Tyler Trkowski has written a Feature for NOISEY (Music by Vice) on Rap Game Riff Raff Textual Analysis. It is a neat example of text analysis outside the academy. He used Voyant and Many Eyes to analyze Riff Raff’s lyrical canon. (Riff Raff, or Horst Christian Simco, is an eccentric rapper.) What is neat is that they embedded a Voyant word cloud right into their essay along with Word Trees from Many Eyes. Riff Raff apparently “might” like “diamonds” and “versace”.
Category: Text Analysis
HedgeChatter – Social Media Stock Sentiment Analysis Dashboard
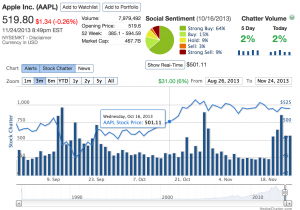
HedgeChatter – Social Media Stock Sentiment Analysis Dashboard is a site that analyzes social media chatter about stocks and then lets you see how a stock is doing. In the picture above you can see the dashboard for Apple (APPL). Rolling over it you can see what people are saying over time – what the “Social Sentiment” is for the stock. I’m assuming with an account one can keep a portfolio and perhaps get alerts when the sentiment drops.
To do this they must have some sort of text analysis running that gives them the sentiment.
Supporting Digital Scholarship
The Tri-Council Agencies (Research councils of Canada) and selected other institutions (going under the rubric TC3+) have released an important Consultation Document titled Capitalizing on Big Data: Toward a Policy Framework for Advancing Digital Scholarship in Canada. You can see a summary blog entry from the CommerceLab, How big data is reshaping the future of digital scholarship in Canada. The document suggest that we have many of the components of a “well-functioning digital infrastructure ecosystem for research and innovation”, but that these are not coordinated and Canada is not keeping up. They propose three initiatives:
- Establishing a Culture of Stewardship
- Coordination of Stakeholder Engagement
- Developing Capacity and Future Funding Parameters
The first initiative is about research data management and something we have been working on the digital humanities for some time. It is great to see a call from our funding agencies.
The Wedding Data: What Marriage Notices Say About Social Change
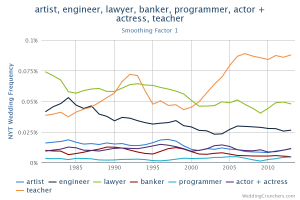
Reading a collection of stories in the Atlantic about women and technology I came across a story about The Wedding Data: What Marriage Notices Say About Social Change. This article talks about Weding Crunchers – a database of New York Times wedding announcements since 1981 that you can search in an environment much like Google’s Ngram viewer. In the chart above you can see that I searched for different professions. Note how “teacher” takes off, probably because of the popularity of Teach for America.
I can’t help wondering if we are seeing the emergence of a genre of text visualization – the diachronic word viewer. This type of visualization depends on an associations between orthographic words (the actual words in texts) and concepts.
The Programming Historian 2: Cleaning OCR’d text
The Programming Historian 2 is producing some very useful tutorials including some on Cleaning OCR’d Text with Regular Expressions. This was started by William J Turkel and others and is now supported by the Center for History and New Media. The tutorials are released under a Creative Commons so they can be copied and adapted.
Multipoint Touch Variorum
Luciano Frizzera has put the video up that he showed at Digital Humanities 2013 in our INKE panel. His video shows his multi-point touch variorum edition prototypes. He has been prototyping how we could use gestures on large screens, especially tables. He has interesting ideas about how people can discuss something on different sides of a table.
Rowling and “Galbraith”: an authorial analysis
JK Rowling has been recently uncovered at the author of The Cuckoo’s Calling which was submitted under the name Robert Galbraith. The Sunday Times revealed this after a hint on Twitter and some forensic stylometry. Patrick Juola, one of the two people to do the analysis has a guest blog where he talks about what he did at: Rowling and “Galbraith”: an authorial analysis. Great short description of an authorship attribution project.
NSA slides explain the PRISM data-collection program
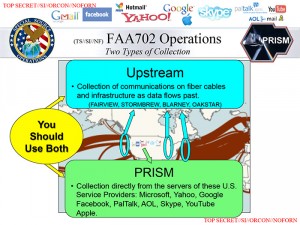
The Washington Post has been publishing NSA slides that explain the PRISM data-collection program. These slides not only explain aspects of PRISM, but also allow us to see how the rhetoric of text analysis unfolds. How do people present PRISM to others? Note the “You Should Use Both” – the imperative in the voice.
Vicar – Access to Abbot TEI-A Conversion!
The brilliant folk at Nebraska and at Northwestern have teamed up to use Abbott and EEBO-MorphAdorner on a collection of TCP-ECCO texts. The Abbot tools is available here, Vicar – Access to Abbot TEI-A Conversion! Abbot tries to convert texts with different forms of markup into a common form. MorphAdorner does part of speech tagging. Together they have made available 2,000 ECCO texts that can be studied together.
I’m still not sure I understand the collaboration completely, but I know from experience that analyzing XML documents can be difficult if each document uses XML differently. Abbot tries to convert XML texts into a common form that preserves as much of the local tagging as possible.
Social Digital Scholarly Editing
On July 11th and 12th I was at a conference in Saskatoon on Social Digital Scholarly Editing. This conference was organized by Peter Robinson and colleagues at the University of Saskatchewan. I kept conference notes here.
I gave a paper on “Social Texts and Social Tools.” My paper argued for text analysis tools as a “reader” of editions. I took the extreme case of big data text mining and what scraping/mining tools want in a text and don’t want in a text. I took this extreme view to challenge the scholarly editing view that the more interpretation you put into an edition the better. Big data wants to automate the process of gathering and mining texts – big data wants “clean” texts that don’t have markup, annotations, metadata and other interventions that can’t be easily removed. The variety of markup in digital humanities projects makes it very hard to clean them.
The response was appreciative of the provocation, but (thankfully) not convinced that big data was the audience of scholarly editors.


