IBM to close Many Eyes

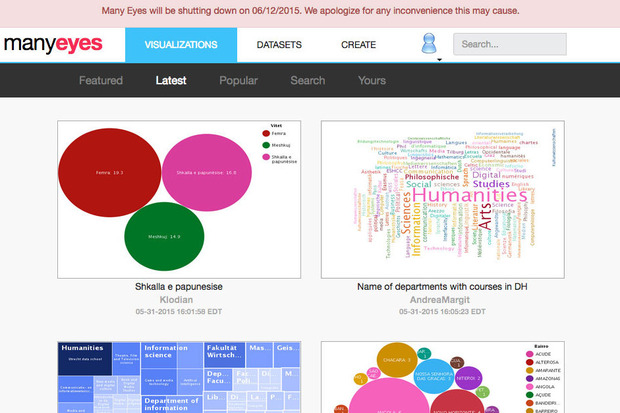
I just discovered that IBM to close Many Eyes. This is a pity. It was  great environment that let people upload data and visualize it in different ways. I blogged about it ages ago (in computer ages anyway.) In particular I liked their Word Tree which seems one of the best ways to explore language use.

It seems that some of the programmers moved on and that IBM is now focusing on Watson Analytics.

What’s in a number? William Shakespeare’s legacy analysed

shakespeare

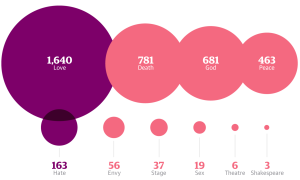
The Guardian published an article on What’s in a number? William Shakespeare’s legacy analysed (April 22, 2016). This article is part of a Shakespeare 400 series in honour of the 400th anniversary of the bard’s death. The article is introduced thus:

Shakespeare’s ability to distil human nature into an elegant turn of phrase is rightly exalted – much remains vivid four centuries after his death. Less scrutiny has been given to statistics about the playwright and his works, which tell a story in their own right. Here we analyse the numbers behind the Bard.

The authors offer a series of visualizations of statistics about Shakespeare that are rather more of a tease than anything really interesting. They also ignore the long history of using quantitative methods to study Shakespeare going back to Mendenhall’s study of authorship using word lengths.

Mendenhall, T. C. (1901). “A Mechanical Solution of a Literary Problem.” The Popular Science Monthly. LX(7): 97-105.

Literature Measured

I finally got around to reading the latest Pamphlets of the Stanford Literary Lab. This pamphlet, 12. Literature Measured (PDF) written by Franco Moretti, is a reflection on the Lab’s research practices and why they chose to publish pamphlets. It is apparently the introduction to a French edition of the pamphlets. The pamphlet makes some important points about their work and the digital humanities in general.

Images come  first, in our pamphlets, because – by visualizing empirical findings – they constitute the specific object of study of computational criticism; they are our “text”; the counterpart to what a well-defined excerpt is to close reading. (p. 3)

I take this to mean that the image shows the empirical findings or the model drawn from the data. That model is studied through the visualization. The visualization is not an illustration or supplement.

By frustrating our expectations, failed experiments “estrange” our natural habits of thought, offering us a chance to transform them. (p. 4)

The pamphlet has a good section on failure and how that is not just a rhetorical ploy, but important to research. I would add that only certain types of failure are so. There are dumb failures too. He then moves on to the question of successes in the digital humanities and ends with an interesting reflection on  how the digital humanities and Marxist criticism don’t seem to have much to do with each other.

But he (Bordieu) also stands for something less obvious, and rather perplexing: the near-absence from digital humanities, and from our own work as well, of that other sociological approach that is Marxist criticism (Raymond Williams, in “A Quantitative Literary History”, being the lone exception). This disjunction – perfectly mutual, as the indiference of Marxist criticism is only shaken by its occasional salvo against digital humanities as an accessory to the corporate attack on the university – is puzzling, considering the vast social horizon which digital archives could open to historical materialism, and the critical depth which the latter could inject into the “programming imagination”. It’s a strange state of a airs; and it’s not clear what, if anything, may eventually change it. For now, let’s just acknowledge that this is how things stand; and that – for the present writer – something needs to be done. It would be nice if, one day, big data could lead us back to big questions. (p. 7)

Blockbusters: how Rutherford Chang became the second best Tetris player in the world

The Guardian has a story about Blockbusters: how Rutherford Chang became the second best Tetris player in the world. Chang is an artist who has been playing Tetris over and over and filming it. His hundreds of thousands of games can be viewed on YouTube here.

How is this art? I suspect it is in the way he plays with repetition. Another project, Alphabetized Newspaper, takes all the words in stories on the cover of The New York Times and rearranges them in alphabetical order created a sort of sorted word list. (Click image and explore.)

alphabetized


He also did this with video of NBC nightly news, which produces a bizarre effect. Imagine all the very short clips of people saying “and” in a row.

I am struck by how he has humanly recreated what an algorithm could do.


LOTRProject: Visualizing the Lord of the Rings

ChrctrMentions

Emil Johansson, a student in Gothenburg, has created a fabulous site called the LOTRProject (or Lord Of The Rings Project. The site provides different types of visualizations about Tolkien’s world (Silmarillion, Hobbit, and LOTR) from maps to family trees to character mentions (see image above).

Continue reading LOTRProject: Visualizing the Lord of the Rings

Literary Analysis and the Wolfram Language

digital-research-methods-cover-2015-medium

Lately I’ve been trying Wolfram Mathematica more an more for analytics. I was introduced to Mathematica by Bill Turkel and Ian Graham who have done some impressive stuff with it. Bill Turkel has now created a open access, open content, and open source textbook Digital Research Methods with Mathematica. The text is a Mathematica notebook itself so, if you have Mathematica you can actually use the text to do analytics on the spot.

Wolfram has also posted an interesting blog entry on Literary Analysis and the Wolfram Language: Jumping Down a Reading Rabbit Hole. They show how you can generate word clouds and sentiment analysis graphs easily.

While I am still learning Mathematica, some of the features that make it attractive include:

  • It uses a “literate programming” model where you write notebooks meant to be read by humans with embedded code rather than writing code with awkward comments embedded.
  • It has a lot of convenient Web, Language, and Visualization functions that let you do things we want to do in the digital humanities.
  • You can call on Wolfram Alpha in a notebook to get real world knowledge like capital cities or maps or language information.

Text Mining The Novel 2015

novelTMworkshop

On Thursday and Friday (Oct. 22nd and 23rd) I was at the 2nd workshop for the Text Mining the Novel project. My conference notes are here Text Mining The Novel 2015. We had a number of great papers on the issue of genre (this year’s topic.) Here are some general reflections:

  • The obvious weakness of text mining is that it operates on the novel as text, specifically digital text (or string.) We need to find ways to also study the novel as material object (thing), as a social object, as a performance (of the reader), and as an economic object in a market place. Then we also have to find ways to connect these.
  • So many analytical and mining processes depend on bags of words from dictionaries to topics. Is this a problem or a limitation? Can we try to abstract characters, plot, or argument.
  • I was interested in the philosophical discussions around the epistemological in novels and philosophical claims about language and literature.


diyMatrix: Bertin’s Manual

bertin machine

I have long been interested in Jacques Bertin, a pioneer in thinking about visualization. His Semiology of Graphics is a classic. I had been thinking it would be great to try or simulate his way of doing cluster analysis with physical matrices which he called “dominos”. I was therefore pleased to see that someone has recreated his matrices, see DIY Matrix.

Charles Perin, Pierre Dragicevic, and Jean-Daniel Fekete have updated the matrices and fabricated a version for a CHI’15 workshop on Investigating the Challenges of Making Data Physical (PDF).

Update: They also have a web application called Bertifier that allows you to try it virtually. This interactive allows you to choose different ways of decorating the blocks and will then also reorder them. It is fascinating to play with.

interactiveBertin

Now I have something I want to print on a fabricator.