Conference Report: Tools For Data-Driven Scholarship

I just got back from the Tools For Data-Driven Scholarship meeting organized by MITH and the Centre for New Media and History. This meeting was funded by the NEH, NSF, and the IMLS and brought together tool developers, content providers (like museums and public libraries), and funders (NEH, JISC, Mellon, NSF and IMLS.) The goal was to imagine initiative(s) that could advance humanities tool development and connect tools better with audiences. I have written a Conference Report with my notes on the meeting. One of the interesting questions asked by a funder was “What do the developers really want?” It was unclear that developers really wanted some of the proposed solutions like a directory of tools or code repository. Three things the breakout group I was in came up with was:

  • Recognition, credit and rewards for tool development – mechanisms to get academic credit for tool development. This could take the form of tool review, competitions, prizes or just citation when our tool is used. In other words we want attention.
  • Long-term Funding so that tool development can be maintained. A lot of tool development takes place in grants that run out before the tool can really be tested and promoted to the community. In other words we want funding to continue tool development without constantly writing grants.
  • Methods, Recipes, and Training that are documented that bring together tools in the context of humanities research practices. We want others with the outreach and writing skills to weave stories about their use to help introduce tools to others. In other words we want others to do the marketing of our tools.

A bunch of us sitting around after the meeting waiting for a plane had the usual debriefing about such meetings. What do they achieve even if they don’t lead to initiatives. From my perspective these meeting are useful in unexpected ways:

  • You meet unexpected people and hear about tools that you didn’t know about. The social dimension is important to meetings organized by others that bring people together from different walks. I, for example, finally met William Turkle of Digital History Hacks.
  • Reports are generated that can be used to argue for support without quoting yourself. There should be a report from this meeting.
  • Ideas for initiatives are generated that can get started in unexpected ways. Questions emerge that you hadn’t thought of. For example, the question of audience (both for tools and for initiatives) came up over and over.
Fortune of the Day – Fortune Hunting

Visual Collocator

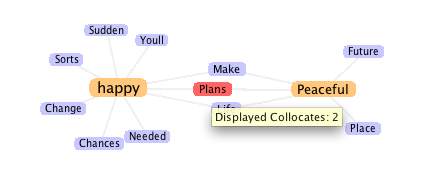
Lisa Young with the support of the Brown University Scholarly Technology Group (STG) has developed a Fortune of the Day – Fortune Hunting interactive art site based on a collection of scanned fortune cookie slips she created. It has elements of a public textuality site like the Dictionary though focused completely on fortunes. The interface is simple and elegant. I believe it has been exhibited recently for the first time. The project uses the TAPoRware Visual Collocator for one of its interfaces.

CaSTA 2008: New Directions in Text Analysis

CaSTA 08 LogoI am at the CaSTA 2008 New Directions in Text Analysis conference at the University of Saskatchewan in Saskatoon. The opening keynote by Meg Twycross was a thorough and excellent tour through manuscript digitization and forensic analysis techniques.

My notes are in a conference report (being written as it happens.)

AHRC ICT Methods Network: Final Report

I just came across the AHRC ICT Methods Network Final Report edited by Lorna Hughes. It is one of the most thorough final reports of its kind and nicely designed. There is a bitter-sweet conclusion to the report by Susan Hockey and Seamus Ross as the AHDS (Arts and Humanities Data Service) seems to have had its funding cut and therefore cannot renew the Methods Network (or support the Oxford Text Archive either.) As the home page of the AHDS says, “From April 2008 the Arts and Humanities Data Service (AHDS) will no longer be funded to provide a national service.” The conclusion by Susan and Seamus states unequivocally that,

In conclusion, the activities of the Methods Network demonstrated not only that ICT methods and tools are central to humanities scholarship, but also that there was ‘a very long way to go before ICT in humanities and arts research finds its rightful and needed places’. The investment in ICT in the arts and humanities needs to be much greater and it needs to reflect better the particularities and needs of individual communities. Researchers who do not have access to the most current technological methods and tools will not be able to keep
pace with the trends in scholarship. There is a real need for support and infrastructure for distributed research. (page 74)

Interestingly they propose a “flexible co-ordinated network of centres of excellence as the best way forwards”. (Page 74) I also liked the report because it kindly mentions TAPoR,

The group looked at how collaborations are fostered and supported, how partnerships are brokered in the first instance, and how this work is rewarded and evaluated by the different communities. Geoffrey Rockwell, Project Director of what is almost certainly the largest collaborative humanities software development project in the world, the TAPoR (http://portal.tapor.ca/portal/portal) project in Canada, shared his experiences of how the development of a collaborative and inter-institutional set of tools for text analysis was managed within the project. TAPoR was funded by the Canada Foundation for Innovation and succeeded in its overall goals in providing general purpose text analysis tools. The TAPoR site reports that its tools were run over 5000 times in November 2007. TAPoR provides strong evidence that networked collaborative tool development can succeed. (Page 63)

New Version of TAPoR Portal

We have upgraded the TAPoR Portal to version 1.1 (the Dundas version.) The upgrades include:

  • French language skin has been rewritten.
  • You can now enter a text that is just a bibliographic reference which doesn’t link to a full text and the system will handle it.
  • The Research Log now hides the results to make it easier to load and navigate.
  • Security and interface upgrades.

Signs of the Times – Now, Analyze That – Reprinted

George Loper, who heard me speak at the University of Virginia New Horizons talk, has posted a “reprint” of our Now, Analyze That essay, under the title, Signs of the Times – Now, Analyze That: Obama and Wright on Race in America.

It is interesting to see how the essay looks reposted in a different environment. Loper has focused on the essay, not the interactivity, as that is his interest.

Now, Analyze That: An Experiment in Text Analysis

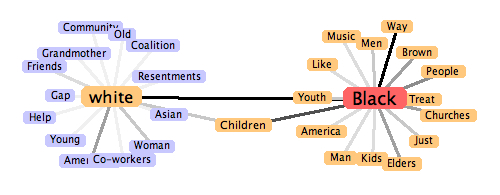
Image from Visual Collocator

Stéfan Sinclair and I have just finished writing up an essay from an extreme text analysis session, Now, Analyze That. It is first of all a short essay comparing Obama and Wright’s recent speeches on race. The essay reports on what we found in a two day experiment using our own tools and it has interactive handles woven in that let you recapitulate our experiment.

The essay was written in order to find a way of write interpretative essays that are based on computer-assisted text analysis and exhibit their evidence appropriately without ending up being all about the tools. We are striving for a rhetoric that doesn’t hide text analysis methods and tools, but is still about interpretation. Having both taught text analysis we have both found that there are few examples of short accessible essays about something other than text analysis that still show how text analysis can help. The analysis either colonizes the interpretation or it is hidden and hard for students and others to recapitulate. Our experiments are therefore attempts to write such essays and document the process from conception (coming up with what we want to analyze) to online publication.

Doing the analysis in a pair where one of did the analysis and one documented and directed was a discovery for me. You really do learn more when you work in a pair and force yourself to take roles. I’m intrigued at how agile programming practices can be applied to humanities research.

This essay comes out of our second experiment. The first wasn’t finished because we didn’t devote enough time together to it (we really need about two days and that doesn’t include writing up the essay.) There will be more experiments as the practice of working together has proven a very useful way to test the TAPoR Portal and think through how tools can support research all the way through the life of a project, from conceptualization to publication. I suspect as we try different experiments we will be changing the portal and the tools. too often tools are designed for the exploratory stage of research instead of the whole cycle right to where you write an essay.

You can, of course, actually use the same tools we used on the essay itself. At the bottom of the left-hand column there is an Analysis Tool bar that gives you tools that will run on the page itself.

T-REX: TADA Research Evaluation Exchange

T-REX logo

Stéfan Sinclair of TADA has put together an exciting evaluation exchange competition, T-REX | TADA Research Evaluation Exchange. This came out of discussions with Steve Downie about MIREX (Music Information Retrieval Evaluation eXchange) and our discussions with the SHARCNET folk and then DHQ. The initial idea is to have a competition for ideas for tools for TAPoR, but then to migrate to a community evaluation exchange where we agree on challenges and then compare and evaluate different solutions. We hope this will be a way to move tool development forward and get recognition for it.

Thanks to Open Sky Solutions for supporting it.

VersionBeta3 < Main < WikiTADA

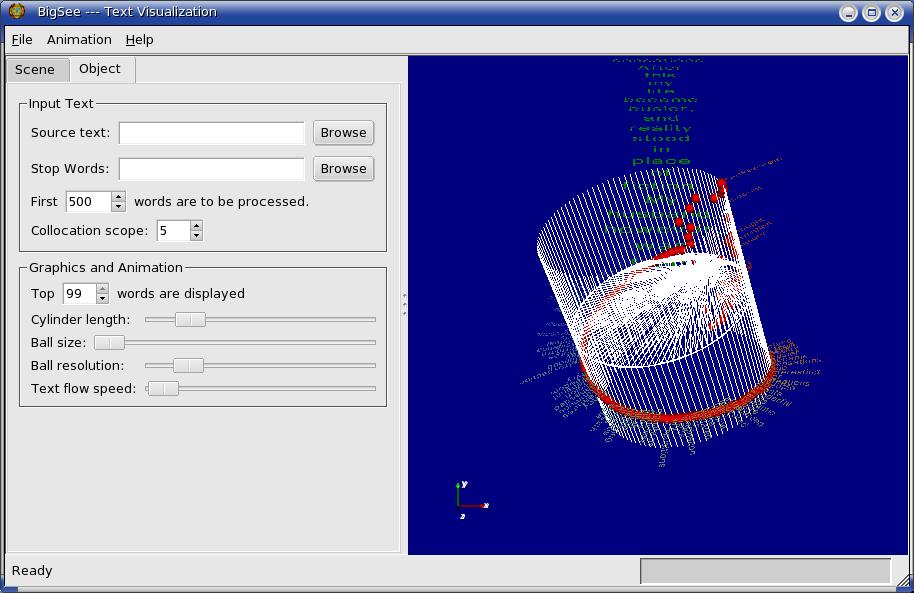
Screen Shot of BigC GUI

We have a new version of the Big See collocation centroid. Version Beta 3 now has a graphical user interface where you can control settings before running the animation and once the animation is run. As before we show the process of developing the 3D model as an animation. Once run you can manipulate the 3D model. If you turn on stereo you can see the text model as a 3D object if you have the right glasses on (it supports different types including red/green.)

I’m still trying to articulate the goals of the project. Like any humanities computing project the problem and solutions are emerging as we develop and debate. I now think of it as an attempt to develop a visual model of a text that can be scaled out to very high resolution displays, 3D displays, and high performance computing. The visual models we have in the humanities are primitive – the scrolling page and the distribution graph. TextArc introduced a model, the weighted centroid, that is rich and rewards exploration. I’m trying to extend that into three dimensions while weaving in the distribution graph. Think of the Big See is a barrel of distributions.