The Washington Post has been publishing NSA slides that explain the PRISM data-collection program. These slides not only explain aspects of PRISM, but also allow us to see how the rhetoric of text analysis unfolds. How do people present PRISM to others? Note the “You Should Use Both” – the imperative in the voice.
Category: Text Analysis
Vicar – Access to Abbot TEI-A Conversion!
The brilliant folk at Nebraska and at Northwestern have teamed up to use Abbott and EEBO-MorphAdorner on a collection of TCP-ECCO texts. The Abbot tools is available here, Vicar – Access to Abbot TEI-A Conversion! Abbot tries to convert texts with different forms of markup into a common form. MorphAdorner does part of speech tagging. Together they have made available 2,000 ECCO texts that can be studied together.
I’m still not sure I understand the collaboration completely, but I know from experience that analyzing XML documents can be difficult if each document uses XML differently. Abbot tries to convert XML texts into a common form that preserves as much of the local tagging as possible.
Social Digital Scholarly Editing
On July 11th and 12th I was at a conference in Saskatoon on Social Digital Scholarly Editing. This conference was organized by Peter Robinson and colleagues at the University of Saskatchewan. I kept conference notes here.
I gave a paper on “Social Texts and Social Tools.” My paper argued for text analysis tools as a “reader” of editions. I took the extreme case of big data text mining and what scraping/mining tools want in a text and don’t want in a text. I took this extreme view to challenge the scholarly editing view that the more interpretation you put into an edition the better. Big data wants to automate the process of gathering and mining texts – big data wants “clean” texts that don’t have markup, annotations, metadata and other interventions that can’t be easily removed. The variety of markup in digital humanities projects makes it very hard to clean them.
The response was appreciative of the provocation, but (thankfully) not convinced that big data was the audience of scholarly editors.
Data Analytics’ Next Big Feat: Sarcasm Detection
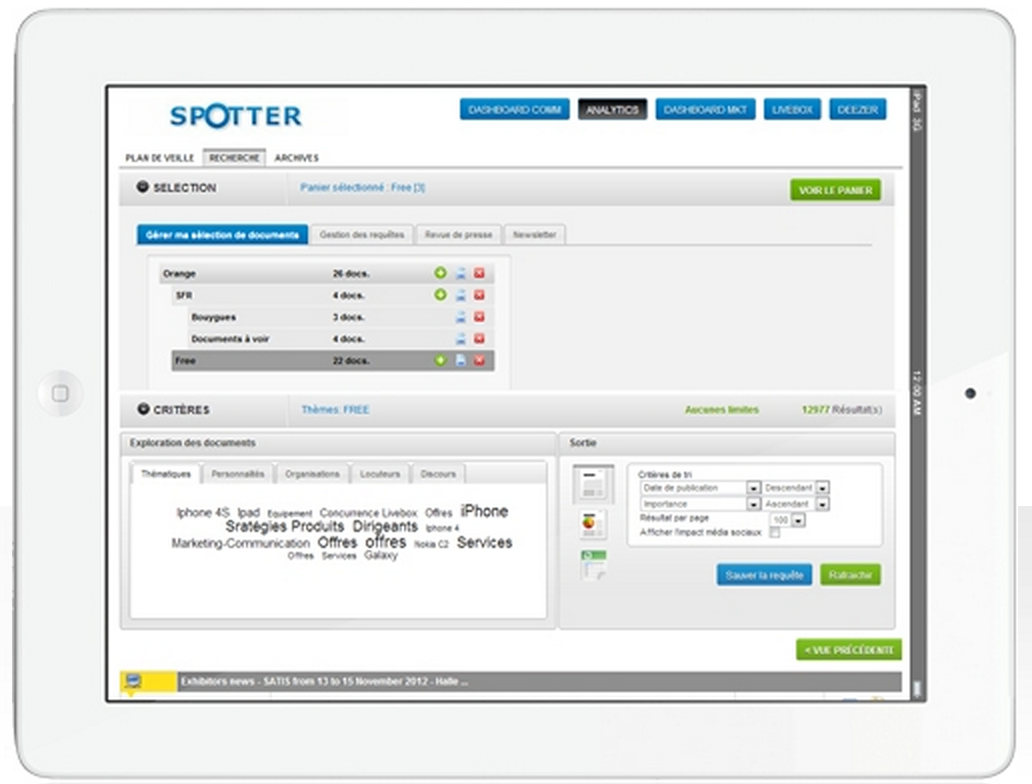
Slashdot has a story about Data Analytics’ Next Big Feat: Sarcasm Detection. The BBC article that this draws from says the French company Spotter has algorithms for 29 different languages and that they can “identify sentiment up to an 80% accuracy rate.”
A screen shot from Spotter shows a tool running on an iPad with a word cloud for exploration and selection tools.
The same Slashdot story sent me also to a Wall Street Journal story about how the Obama 2012 campaign used Salesforce for sentiment analysis on email coming into the campaign.
World Development Indicators – Google Public Data Explorer
Ryan sent me a link to World Development Indicators – Google Public Data Explorer. This is a great visual data explorer with lots of data already available. It looks like the Gapminder Trendanalyzer, which Google bought in 2007. (Gapminder is now focused on keeping statistical data up-to-date and producing related media.) In Google Public Data you can search for datasets and then play with the type of visualization and so on. I’m struck by how this model of weaving datasets and tools together works so simply with the tools adapting to the datasets. I wonder if we could do something like this for texts?
Gapminder’s Hans Rosling has a TED talk on Stats that reshape your worldview that is worth watching where he talks about preconceptions we have about the world. He is really good at showing how much things have changed so that preconceptions true in the 1960s are not longer valid.
As Megan Garber explains in Dataviz, democratized: Google opens Public Data Explorer, one of the things Google has done is to now allow us to upload our data too, so this ceases to be such a passive interpretation tool. The trick is the Dataset Publishing Language that lets uploaders describe their data so the Public Data Explorer can present it properly.
The Expression of Emotions in 20th Century Books
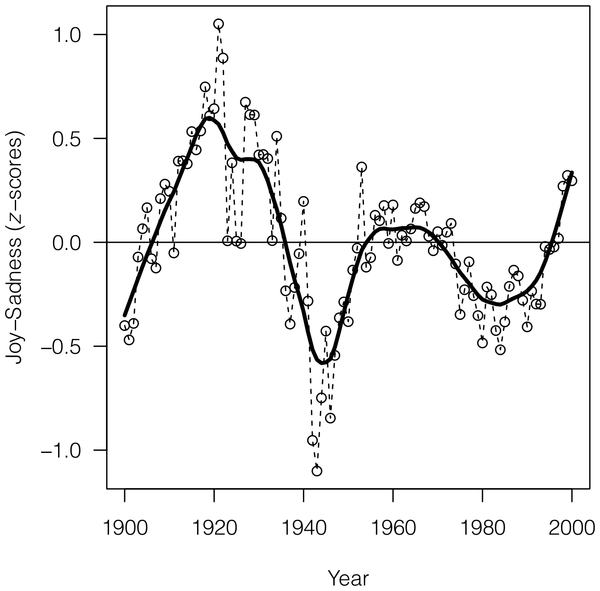
Emilie pointed me to an NPR strory on mining mood in 20th century books, Mining Books To Map Emotions Through A Century. This story draws on a very readable article The Expression of Emotions in 20th Century Books in PLOS One. The article reports on a study of “mood” or sentiment over time in literature. The used the Google Ngram data. I like how they report first and then discuss methodology at the end.
They mention support from an interesting EU funded project TrendMiner. TrendMiner is developing real-time multi-lingual analysis tools.
Continue reading The Expression of Emotions in 20th Century Books
Tool Discourse
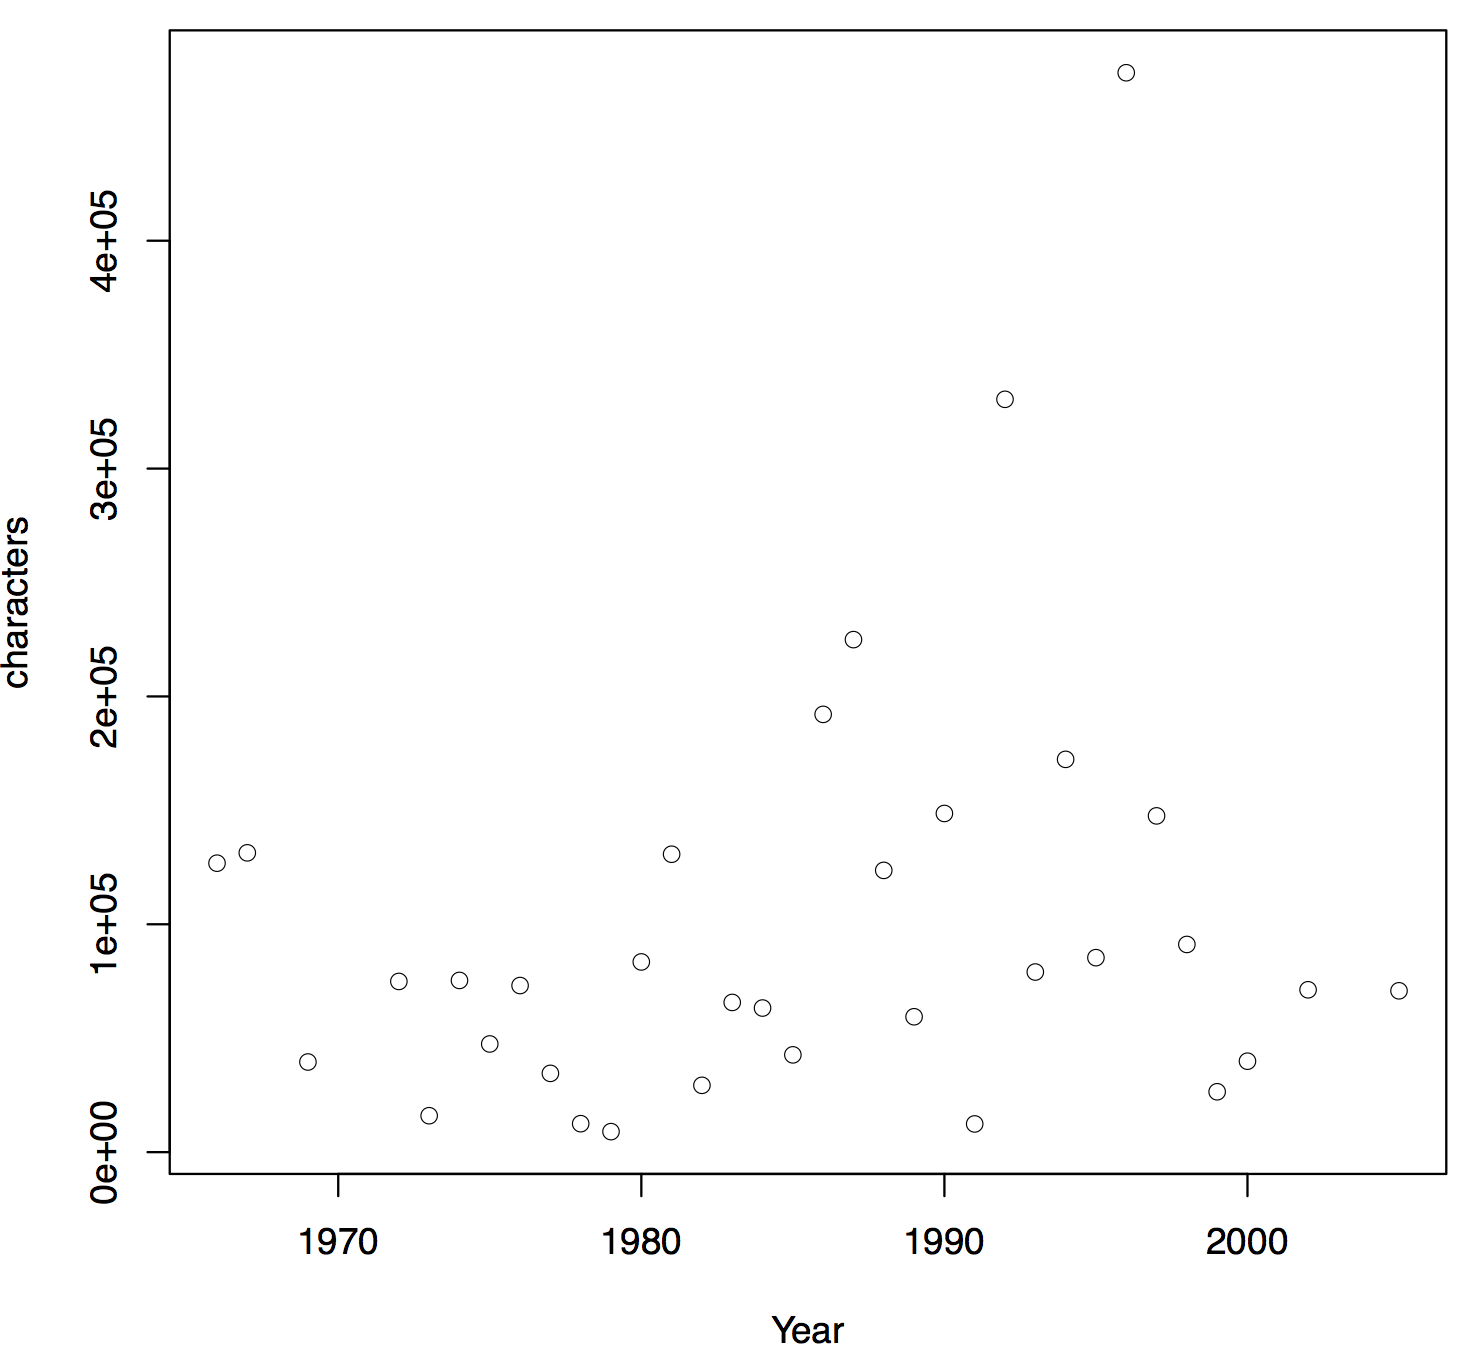
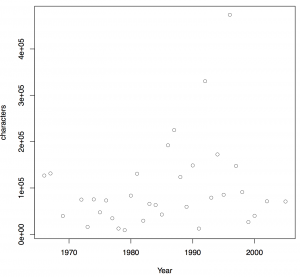
We are finally getting results in a long slow process of trying to study tool discourse in the digital humanities. Amy Dyrbe and Ryan Chartier are building a corpus of discourse around tools that includes tool reviews, articles about what people are doing with tools, web pages about tools and so on. We took the first coherent chunk and Ryan has been analyzing it with R. The graph above shows which years have the most characters. My hypothesis was that tool reviews and discourse dropped off in the 1990s as the web became more important. This seems to be wrong.
Here are the high-frequency words (with stop words removed). Note the modal verbs “can”, “will”, and “may.” They indicate the potentiality of tools.
“can” 2305
“one” 1996
“text” 1940
“word” 1931
“words” 1859
“program” 1606
“ii” 1514 (Not sure why)
“will” 1361
“language” 1307
“data” 1285
“two” 1188
“system” 1183
“computer” 1116
“used” 1115
“use” 942
“user” 939
“file” 890
“first” 870
“may” 853
“also” 837
Diagramming Text Analysis
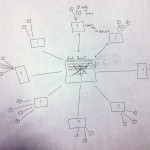
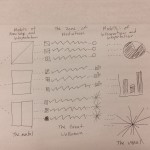
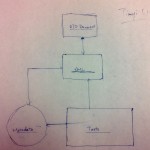
I asked some graduate students to draw diagrams theorizing text analysis. This was partly so that we could test ideas about how things (like diagrams) communicate. Here you can see the diagrams that Carmen, Jared, Samia, Sandra, and Tianyi developed.
I must admit I would never have thought of some of the visual ideas they deployed.
Textal – Text Analysis for your mobile
Textal is a moble app (for the iPhone) that lets you “explore the words used in your favourite book, document, website, or twitter stream.” It looks beautiful, but I can’t find it on the app store. I like the idea of having something like this for my iPad on which I read more and more.
Virtual Research Worlds: New Technology in the Humanities – YouTube
The folk at TextGrid have created a neat video about new technology in the humanities, Virtual Research Worlds: New Technology in the Humanities. The video shows the connection between archives and supercomputers (grid computing). At around 2:20 you will see a number of visualizations from Voyant that they have connected into TextGrid. I love the links tools spawning words before a bronze statue. Who is represented by the statue?
Continue reading Virtual Research Worlds: New Technology in the Humanities – YouTube