Peter sent me to a neat blog, FlowingData that is partly about visualization. Nathan, the author, posts longish notes like 17 Ways to Visualize the Twitter Universe. He also has a good one on 21 Ways to Visualize and Explore Your Email Inbox which has some creative ways to handle spam like Alex Dragulescu’s Spam Architecture that takes spam and generates “three-dimensional modeling gestures”! (I want to be a 3D modeling gesture!)
Category: Visualization
Ong: Secondary Orality and Secondary Visualism
Wandering some more through the Notes from the Walter Ong Collection blog I came across an intriguing note on Revising Secondary Orality and Secondary Visualism. The Walter J. Ong Collection at Saint Louis University has PDFs of lectures including one on Secondary Orality and Secondary Visualism (PDF). In the lecture Ong seems to be thinking about virtual reality as a form of secondary visuality just as radio and television are a secondary orality. If secondary orality is orality which is scripted (while appearing spontaneous like the oral), secondary visuality would be planned while being visually spontaneous. Perhaps the scripting or planning in this case would be the code that makes virtual spaces available rather than the scripting of the humans in the space.
Secondary visuality might be like the VRML Dream – a performance of Shakespeare’s A Midsummer Night’s Dream that was streamed over the Internet with VRML. According to a student who participated when he was younger, they had two sets of performers – the voice actors in one room and the VRML body actors in another. Or secondary visuality could be visualizations that transcode data from one sensory modality to another (from text to the visual.)
High Resolution Visualization
In a previous post I wrote about a High Performance Visualization project. We got the chance to try the visualization on a Toshiba high resolution monitor (something like 5000 X 2500). Above you can see a picture I took with my Blackberry.
What can we do with high resolution displays? What would we show and how could we interact with them? I take it for granted that we won’t just blow up existing visualizations.
High Performance Visualization
I’m working with the folks at our local HPC consortium, SHARCNET on imagining how we could visualize texts with high resolution displays, 3D displays, and cluster computing. The project, temporarily called The Big See has generated an interested beta version. You can see a video on the process running and images from the final visualization here, Version Beta 2.
One of the unanticipated insights from this project is that the process of building the 3D model, which I will call the *animation*, is as interesting as the final visual model. From the very first version you could see the text flowing up and the high frequency words jostling each other for position. Words would start high and then slide clockwise around. Collocations build up as it goes. We don’t have the animation right, but I think we are on to something. You can see Version B2 as an MP4 animation here.
Now we will start playing with the parameters – colours, transparency, and weight of lines.
Tech and the Humanities: The MLA at Chicago
Right after Christmas I was involved in two events at the MLA. I organized and presided over a session on Open Digital Communities which was nicely written up by the Chronicle of Higher Education, Tech and the Humanities: A Report from the Front Lines – Chronicle.com.
I also participated in a newish format for the MLA – what is now being called a digital roundtable on Textual Visualization organized by Maureen Jameson where I showed visualization tools available through TAPoRware and the TAPoR portal.
GUESS: The Graph Exploration System
I came across a very nice visualization by Fairyring (Stephanie Hendrick, a student at the HumLab) after finding that she had been experimenting with TAPoR visualizations and posting them to her Flickr account. In her comments she said she had used the visualization system, GUESS: The Graph Exploration System.
Tagging Games
Peter O pointed me to a new phenomenon on the web that I’ve been meaning to blog for a while. That is the leveraging of human players for tasks that can’t be easily automated. Perhaps the best example is the ESP Game. The online game is described in “How to Play”:
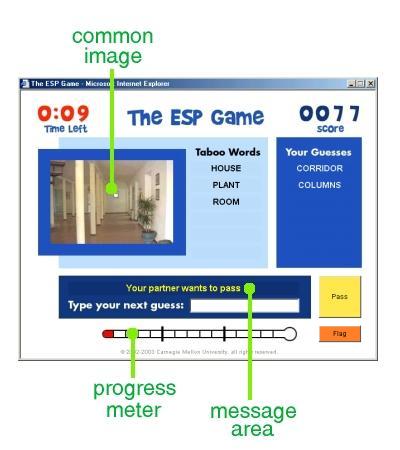
The ESP Game is a two-player game. Each time you play you are randomly paired with another player whose identity you don’t know. You can’t communicate with your partner, and the only thing you have in common with them is that you can both see the same image. The goal is to guess what your partner is typing on each image. Once you both type the same word(s), you get a new image.
The game (and its Google Image Labeler spin-off) leverages fun to get image tagging done. Remember when we thought computer image recognition would do that? Now we are using online games to make it fun for humans to do what we do best – instant complex judgements about the visual. If you get enough people playing we could make serious inroads into tagging the visual web.
What is impressive about ESP is what a simple and powerful idea it is and this is Luis von Ahn‘s second sweet contribution, the first one being CAPTCHA and reCAPTCHA.
While it isn’t quite as clean, a generalized version of the idea of people power is Amazon’s Mechanical Turk. The idea is that people can,
Complete simple tasks that people do better than computers. And, get paid for it. Learn more.
Choose from thousands of tasks, control when you work, and decide how much you earn.
Developers can register tasks, people can work on HITs (Human Intelligence Tasks) and get paid for the work, and Amazon can become the largest labour market for small tasks.
netzspannung.org | Archive | Archive Interfaces
netzspannung.org is a German new media group with an archive of “media art, projects from IT research, and lectures on media theory as well as on aesthetics and art history.” They have a number of interfaces to this archive, for an explanation see, Archive Interfaces. The most interesting is the Java Semantic Map (see picture above.)
netzspannung.org is an Internet platform for artistic production, media projects, and intermedia research. As an interface between media art, media technology and society, it functions as an information pool for artists, designers, computer scientists and cultural scientists. Headed by » Monika Fleischmann and » Wolfgang Strauss, at the » MARS Exploratory Media Lab, interdisciplinary teams of architects, artists, designers, computer scientists, art and media scientists are developing and producing tools and interfaces, artistic projects and events at the interface between art and research. All developments and productions are realised in the context of national and international projects.
See The Semantic Map Interface for more on their Java Web Start archive browser.
Texto Digital: a-writings
Humanist posted an announcement for a new issue of the Brazilian journal Text Digital that includes some interesting animated experiments (like the image above) including a series a-writing by Gerard Dalmon. The address “To the reader” starts with,
To weave, write and inscribe thoughts on the digital medium is the purpose of this journal that reaches its fifth number with a somewhat different content. It is the first time we publish an issue with more creative than theoretic interventions.
The Most Unusual Books of the World
Shawn sent me this link for the The Most Unusual Books of the World. Loyal readers will have seen my Text in the Machine experiment on Flickr (where there is a photoessay).
McMaster’s archives actually have a number of English fore-edge painted books that were, apparently, popular gifts in their time.
I’m trying to imagine a visualization tool that would show you selected passages cut sculpturally out of a 3D book.