Japanese Game Centers

One of the things I noticed about Japanese game culture when I was there was the importance of game centers or arcades. I ended up taking a number of pictures at some of the game centers I visited – see Arcade and Pachinko Flickr set. I’ve just found a great MA thesis by Eric Eickhorst on “Game Centers: A Historical and Cultural Analysis of Japan’s Video Amusement Establishments” (Department of East Asian Languages and Cultures, University of Kansas, 2006). The thesis is a readable work that covers the history, the current state (as of 2006), Japanese attitudes and otaku culture. One interesting statistic he discusses has to do with housewives,

Surprisingly, the number one occupation listed by survey participants was housewife, representing 17.3% of the total number of respondents. This perhaps unexpected result merits a closer examination of the function of game centers for housewives. In response to the question of why they visited game centers, 38.6% of housewives replied that their intent was to change their mood or as a means of killing time, suggesting that such audiences may visit game centers as a way of taking a break from household duties. The function of changing one’s mood or killing time at a game center was the second most common response among all survey respondents, accounting for 32.0% of answers to that question. (p. 51-2)

D3.js – Data-Driven Documents

Stéfan pointed me to this new visualization library, D3.js – Data-Driven Documents. The image above is from their Co-Occurrence Matrix (of characters in Les Misérables.) Here is what they say in the About:

D3.js is a JavaScript library for manipulating documents based on data. D3 helps you bring data to life using HTML, SVG and CSS. D3’s emphasis on web standards gives you the full capabilities of modern browsers without tying yourself to a proprietary framework, combining powerful visualization components and a data-driven approach to DOM manipulation.

Take a look the examples Gallery. There are lots of ideas here for text visualization.

Theoreti.ca is Back

Faithful readers will have noticed that theoreti.ca has been inaccessible off and on since the summer and that it has not been updated for a while. The reason is that theoreti.ca was hacked and my ISP (rightly) insisted on shutting it down until I fixed it. Over the months I have tried a number of things that seemed to temporarily fix the problem, but ultimately failed. Finally I had to turn to a programmer, Hamman Samuel, who has rebuilt the blog from scratch and the associated philosophi.ca wiki. These were rebuilt on another server so there are various linking problems that we are slowly identifying and fixing. I will be reflecting on this experience in future posts. In the meantime I apologize to readers that it took so long to fix.

Hype Cycle from Gartner Inc.

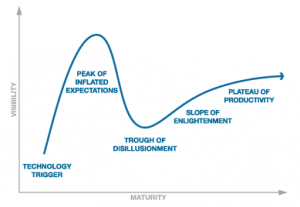
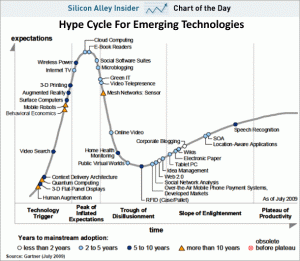
Gartner has an interesting Hype Cycle Research methodology that is based on a visualization.

When new technologies make bold promises, how do you discern the hype from what’s commercially viable? And when will such claims pay off, if at all? Gartner Hype Cycles provide a graphic representation of the maturity and adoption of technologies and applications, and how they are potentially relevant to solving real business problems and exploiting new opportunities.

The method assumes a cycle that new technologies take from:

  • Technology Trigger
  • Peack of Inflated Expectations
  • Trough of Disillusionment
  • Slope of Enlightenment
  • Plateau of Productivity

Here is an example from the Wikipedia:


Conference Report of DH 2012

I’m at Digital Humanities 2012 in Hamburg. I’m writing a conference report on philosophi.ca. The conference started with a keynote by Claudine Moulin that touched on research infrastructure. Moulin was the lead author of the European Science Foundation report on Research Infrastructure in the Humanities (link to my entry on this). She talked about the need for a cultural history of research infrastructure (which the report actually provides.) The humanities should not just import ideas and stories about infrastructure. We should use this infrastructure turn to help us understand the types of infrastructure we already have; we should think about the place of infrastructure in the humanities as humanists.

Pundit: A novel semantic web annotation tool

Susan pointed me to Pundit: A novel semantic web annotation tool. Pundit (which has a great domain name “thepund.it”) is an annotation tool that lets people create and share annotations on web materials. The annotations are triples that can be saved and linked into DBpedia and so on. I’m not sure I understand how it works entirely, but the demo is impressive. It could be the killer-app of semantic web technologies for the digital humanities.

Goodbye Minitel

The French have pulled the plug on Minitel, the videotex service that was introduced in 1982, 30 years ago. I remember seeing my first Minitel terminal in France where I lived briefly in 1982-83. I wish I could say I understood it at the time for what it was, but what struck me then was that it was a awkward replacement for the phonebook. Anyway, as of June 30th, Minitel is no more and France says farewell to the Minitel.

Minitel is important because it was the first large-scale information service. It turned out to not be a scalable and flexible as the web, but for a while it provided the French with all sorts of text services from directories to chat. It is famous for the messageries roses (pink messages) or adult chat services that emerged (and helped fund the system.)

In Canada Bell introduced in the late 1980s a version of Minitel called Alex (after Alexander Graham Bell) first in Quebec and then in Ontario. The service was too expensive and never took off. Thanks to a letter in today’s Globe I discovered that there were some interesting research and development into videotex services in Canada at the Canadian Research Communications Centre in the late 1970s and 1980s. Telidon was a “second generation” system that had true graphics, unlike Minitel.

Despite all sorts of interest and numerous experiments, videotex was never really successful outside of France/Minitel. It needs a lot of content for people to be willing to pay the price and the broadcast model of most trials meant that you didn’t have the community generation of content needed. Services like CompuServe that ran on PCs (instead of dedicated terminals) were successful where videotex was not, and ultimately the web wiped out even the services like Compuserve.

What is interesting, however, is how much interest and investment there was around the world in such services. The telecommunications industry clearly saw large-scale interactive information services as the future, but they were wedded to centralized models for how to try and evolve such a service. Only the French got the centralized model right by making it cheap, relatively open, and easy. That it lasted 30 years is an indication of how right Minitel was, even if the internet has replaced it.


Using Zotero and TAPOR on the Old Bailey Proceedings

The Digging Into Data program commissioned CLIR (Council on Library and Information Resources) to study and report on the first round of the programme. The report includes case studies on the 8 initial projects including one on our Criminal Intent project that is titled  Using Zotero and TAPOR on the Old Bailey Proceedings: Data Mining with Criminal Intent (DMCI). More interesting are some of the reflections on big data and research in the humanities that the authors make:

1. One Culture. As the title hints, one of the conclusions is that in digital research the lines between disciplines and sectors have been blurred to the point where it is more accurate to say there is one culture of e-research. This is obviously a play on C. P. Snow’s Two Cultures. In big data that two cultures of the science and humanities, which have been alienated from each other for a century or two, are now coming back together around big data.

Rather than working in silos bounded by disciplinary methods, participants in this project have created a single culture of e-research that encompasses what have been called the e-sciences as well as the digital humanities: not a choice between the scientific and humanistic visions of the world, but a coherent amalgam of people and organizations embracing both. (p. 1)

2. Collaborate. A clear message of the report is that to do this sort of e-research people need to learn to collaborate and by that they don’t just mean learning to get along. They mean deliberate collaboration that is managed. I know our team had to consciously develop patterns of collaboration to get things done across 3 countries and many more universities. It also means collaborating across disciplines and this is where the “one culture” of the report is aspirational – something the report both announces and encourages. Without saying so, the report also serves as a warning that we could end up with a different polarization just as the separation of scientific and humanistic culture is healed. We could end up with polarization between those who work on big data (of any sort) using computational techniques and those who work with theory and criticism in the small. We could find humanists and scientists who use statistical and empirical methods in one culture while humanists and scientists who use theory and modelling gather as a different culture. One culture always spawns two and so on.

3. Expand Concepts. The recommendations push the idea that all sorts of people/stakeholders need to expand their ideas about research. We need to expand our ideas about what constitutes research evidence, what constitutes research activity, what constitutes research deliverables and who should be doing research in what configurations. The humanities and other interpretative fields should stop thinking of research as a process that turns the reading of books and articles into the writing of more books and articles. The new scale of data calls for a new scale of concepts and a new scale of organization.

It is interesting how this report follows the creation of the Digging Into Data program. It is a validation of the act of creating the programme and creating it as it was. The funding agencies, led by Brett Bobley, ran a consultation and then gambled on a programme designed to encourage and foreground certain types of research. By and large their design had the effect they wanted. To some extent CLIR reports that research is becoming what Digging encouraged us to think it should be. Digging took seriously Greg Crane’s question, “what can you do with a million books”, but they abstracted it to “what can you do with gigabytes of data?” and created incentives (funding) to get us to come up with compelling examples, which in turn legitimize the program’s hypothesis that this is important.

In other words we should acknowledge and respect the politics of granting. Digging set out to create the conditions where a certain type of research thrived and got attention. The first round of the programme was, for this reason, widely advertised, heavily promoted, and now carefully studied and reported on. All the teams had to participate in a small conference in Washington that got significant press coverage. Digging is an example of how granting councils can be creative and change the research culture.

The Digging into Data Challenge presents us with a new paradigm: a digital ecology of data, algorithms, metadata, analytical and visualization tools, and new forms of scholarly expression that result from this research. The implications of these projects and their digital milieu for the economics and management of higher education, as well as for the practices of research, teaching, and learning, are profound, not only for researchers engaged in computationally intensive work but also for college and university administrations, scholarly societies, funding agencies, research libraries, academic publishers, and students. (p. 2)

The word “presents” can mean many things here. The new paradigm is both a creation of the programme and a result of changes in the research environment. The very presentation of research is changed by the scale of data. Visualizations replace quotations as the favored way into the data. And, of course, granting councils commission reports that re-present a heady mix of new paradigms and case studies.