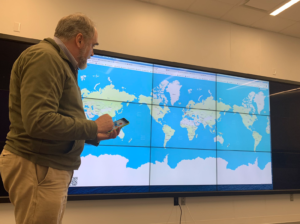
Stéphane Pouyllau’s photo of me presenting
Michael Sinatra invited me to a “show and tell” workshop at the new Université de Montréal campus where they have a long data wall. Sinatra is the Director of CRIHN (Centre de recherche interuniversitaire sur les humanitiés numériques) and kindly invited me to show what I am doing with Stéfan Sinclair and to see what others at CRIHN and in France are doing.
I showed some of the stuff we are working on in Voyant. We have a project called Visual Matters to look at how text visualization could be used on data walls and tables. I showed how one can create custom skins for Voyant with a skin builder (beware, it is in beta) that could be used on wide data walls. I also showed Spyral, the notebook development environment we are developing (also very buggy and subject to changes, so don’t depend on any notebook you create.) Finally, I showed the Book Map which is a prototype of how one could have controls on one set of devices like smartphones and tablets that can control what is on a public screen. That is what you see in the picture above. I have a control on my cell phone that picks the book to be graphed on the wall.
Dr. M. Boni from U de Montréal talked about how one can do cultural analytics in television studies. She leads a project Labo Télé this is looking at different ways to visualize data about television viewing.
Le Labo Télé vise à développer les outils pour l’analyse des formes, des genres, des modes de production, des cultures et de la circulation transmédiale des récits de fiction télévisuels. L’objectif général est d’enrichir la réflexion autour de l’analyse de l’évolution de phénomènes narratifs complexes – composés de plusieurs objets distincts –, transmédiatiques et transnationaux.
She showed a number of interesting visualization tools online that she is using, including the #onemilliontweetmap. I was impressed by how imaginative she was leveraging visualization and off-the-shelf services to study TV viewership.
Stéphane Pouyllau is a lead CNRS researcher with Huma-Num, a large humanities computing infrastructure project. He showed a very interesting geospatial search engine where you could draw a region on the map of the world and it would show you the resources from other databases associated with that region. You could then open up the entry about the item and connect to the original database. It was very impressive and I wondered if they were going to add a timeline to it so one could ask for resources by time and place.
He also talked about how they use touch tables and have used Voyant on them. (Huma-Num runs a Voyant instance.) They bring experts on a subject together around a touch table with lots of relevant data and the experts can explore the data together. I look forward to learning more about how they are using touch tables in research and how Voyant works on them.
Nicolas Sauret then showed Stylo, a lovely clean editor meant for editorial work. Stylo works in markdown and connects with different research search engines like Isidore and other tools like Hypothesis. At the moment it works only online, but it is impressive as a humanities designed editor.
Margot Mellet showed us the online open edition of the Anthologia Palatina that she is working on with others including Marcello Vitali-Rosati (who is also a lead of Stylo). The Anthologia is a complex text of some 400 fragments that has been edited many times and there are many compilations. There are lots of different authors to the original. It is a portrait of an epoch.
The project is developing an open and collaborative editing environment for the Anthologia where anyone can add annotations and pathways, but you can’t touch other people’s stuff. So far they haven’t had any vandalism.
It was interesting how we used the data wall. I didn’t actually use the full data wall as my examples wouldn’t stretch and it didn’t occur to me to set up multiple windows. Others did neat things like put up different windows in different zones and then switch back and forth, a bit like the old slide shows with multiple projectors. One ergonomic thing that stood out is that most tools have the basic controls (like tabs on a browser) at the top. If you aren’t tall enough for the data wall you have to jump to switch tab. We have a lot to learn about interfaces for walls.