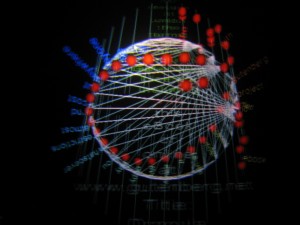
We got the Big See project working in the cave at U Alberta. The Big See software has various 3D modes so it can be displayed for viewing in a CAVE.
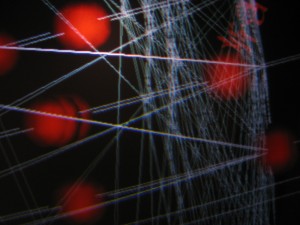
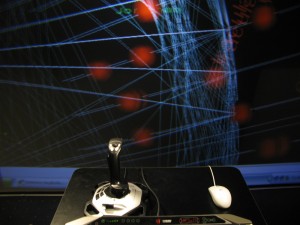
We got the Big See project working in the cave at U Alberta. The Big See software has various 3D modes so it can be displayed for viewing in a CAVE.
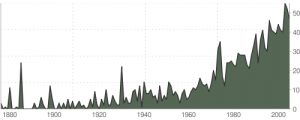
Thanks to Judith I have been playing with JSTOR’s Data for Research (DfR). They provide a faceted way of visualizing and search the entire JSTOR database. Features include:
- Full-text and fielded searching of the entire JSTOR archive using a powerful faceted search interface. Using this interface one can quickly and easily define content of interest through an iterative process of searching and results filtering.
- Online viewing of document-level data including word frequencies, citations, key terms, and ngrams.
- Request and download datasets containing word frequencies, citations, key terms, or ngrams associated with the content selected.
- API for content selection and retrieval. (from the About page)
I’m impressed by how much they expose. They even have a Submit Data Request and an API. This is important – we are seeing a large scale repository exposing its information to new types of queries other than just search.
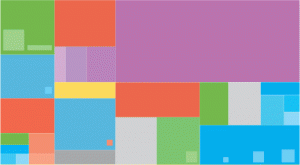
Stan sent me a link to this blog about information and visualization, Information Is Beautiful. Take, for example, The Billion Dollar Gram which shows and compares things that billions of dollars are being spent on.
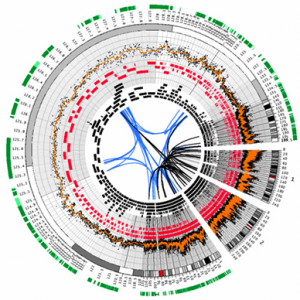
Stan pointed me to a neat circular visualization tool, Circos – visualize genomes and genomic data. As the site title says, Circos is for visualizing genomic information, but the circular model strikes me a applicable to other domains. In fact, Camilo Arango in Computing Science, just defended a MSc thesis on a Course Browser design that uses a circular design to show requisites between courses. While the circular design is attractive, I wonder if it is misleading for linear information, like a text, if one wraps the text around the edge of the circle, the way TextArc does.
The Circos site has an interesting slide show on visualizing quantitative information by Martin Krzywinski that starts with Tufte and then shows different genomic visualization models leading up to Circos.
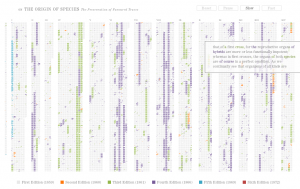
Sean pointed me to a lovely visualization by Ben Fry called The Preservation Of Favoured Traces. The animated visualization shows the edits of Darwin’s The Origin Of Species edition by edition. It is a rich-prospect view of the entire work with color coded lines where changes were made. It was developed in Processing. Ben Fry says the following about the project:
We often think of scientific ideas, such as Darwin’s theory of evolution, as fixed notions that are accepted as finished. In fact, Darwin’s On the Origin of Species evolved over the course of several editions he wrote, edited, and updated during his lifetime. The first English edition was approximately 150,000 words and the sixth is a much larger 190,000 words. In the changes are refinements and shifts in ideas — whether increasing the weight of a statement, adding details, or even a change in the idea itself.
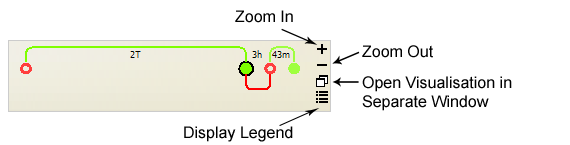
Here is a neat idea for small visualizations to help follow email threads, ThreadVis – Visualising Conversations – Mozilla Thunderbird Add-on. Alexander Hubmann-Haidvogel developed ThreadVis as a Thunderbird Extension as part of his Master’s Thesis, which is available for download (PDF).

Stéfan pointed me to a neat site that has an animated visualization of the History of the Australian Web. The visualization show the rise of sites lik ebay, facebook and google.
I like the use of tabs to control what the dimensions show. The tab is right where the axis is.
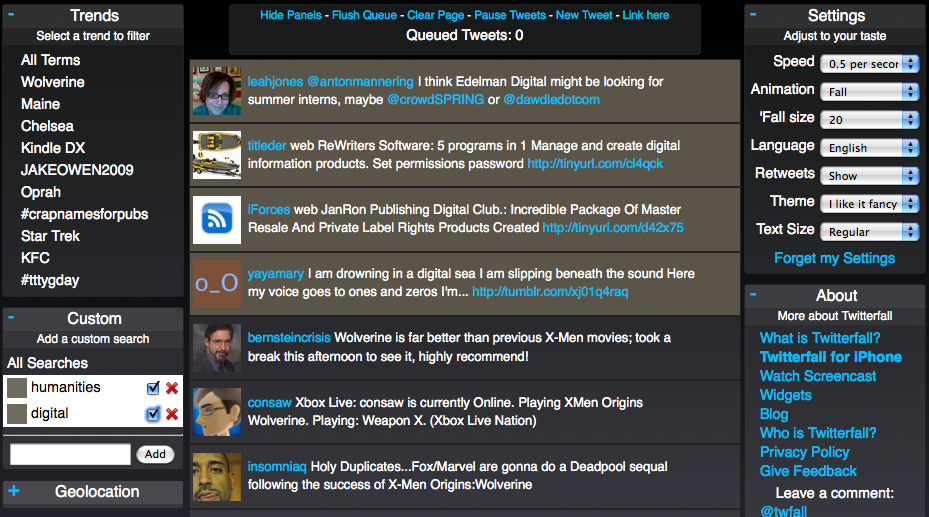
Thanks to James K I discovered Twitterfall which shows a waterfall of tweets based on keywords and other settings. An interesting example of what St̩fan Sinclair and I call a Knowledge Radio Рan application that organizes knowledge into a live stream.
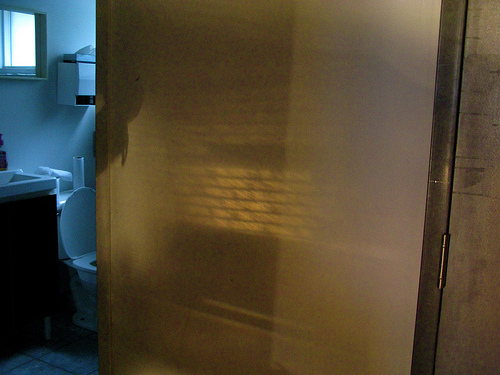
I put a photo set up on Flickr for our Hacking as a Way of Knowing project. The set documents the evolution of the project which I’ve tentatively named the “ReReader for the Writing on the Wall”. Thanks to all those who made the project and the workshop a success. Now I have to think a bit deeper about making as knowing and things as theories.