NYTimes: Inequality and Web Search Trends

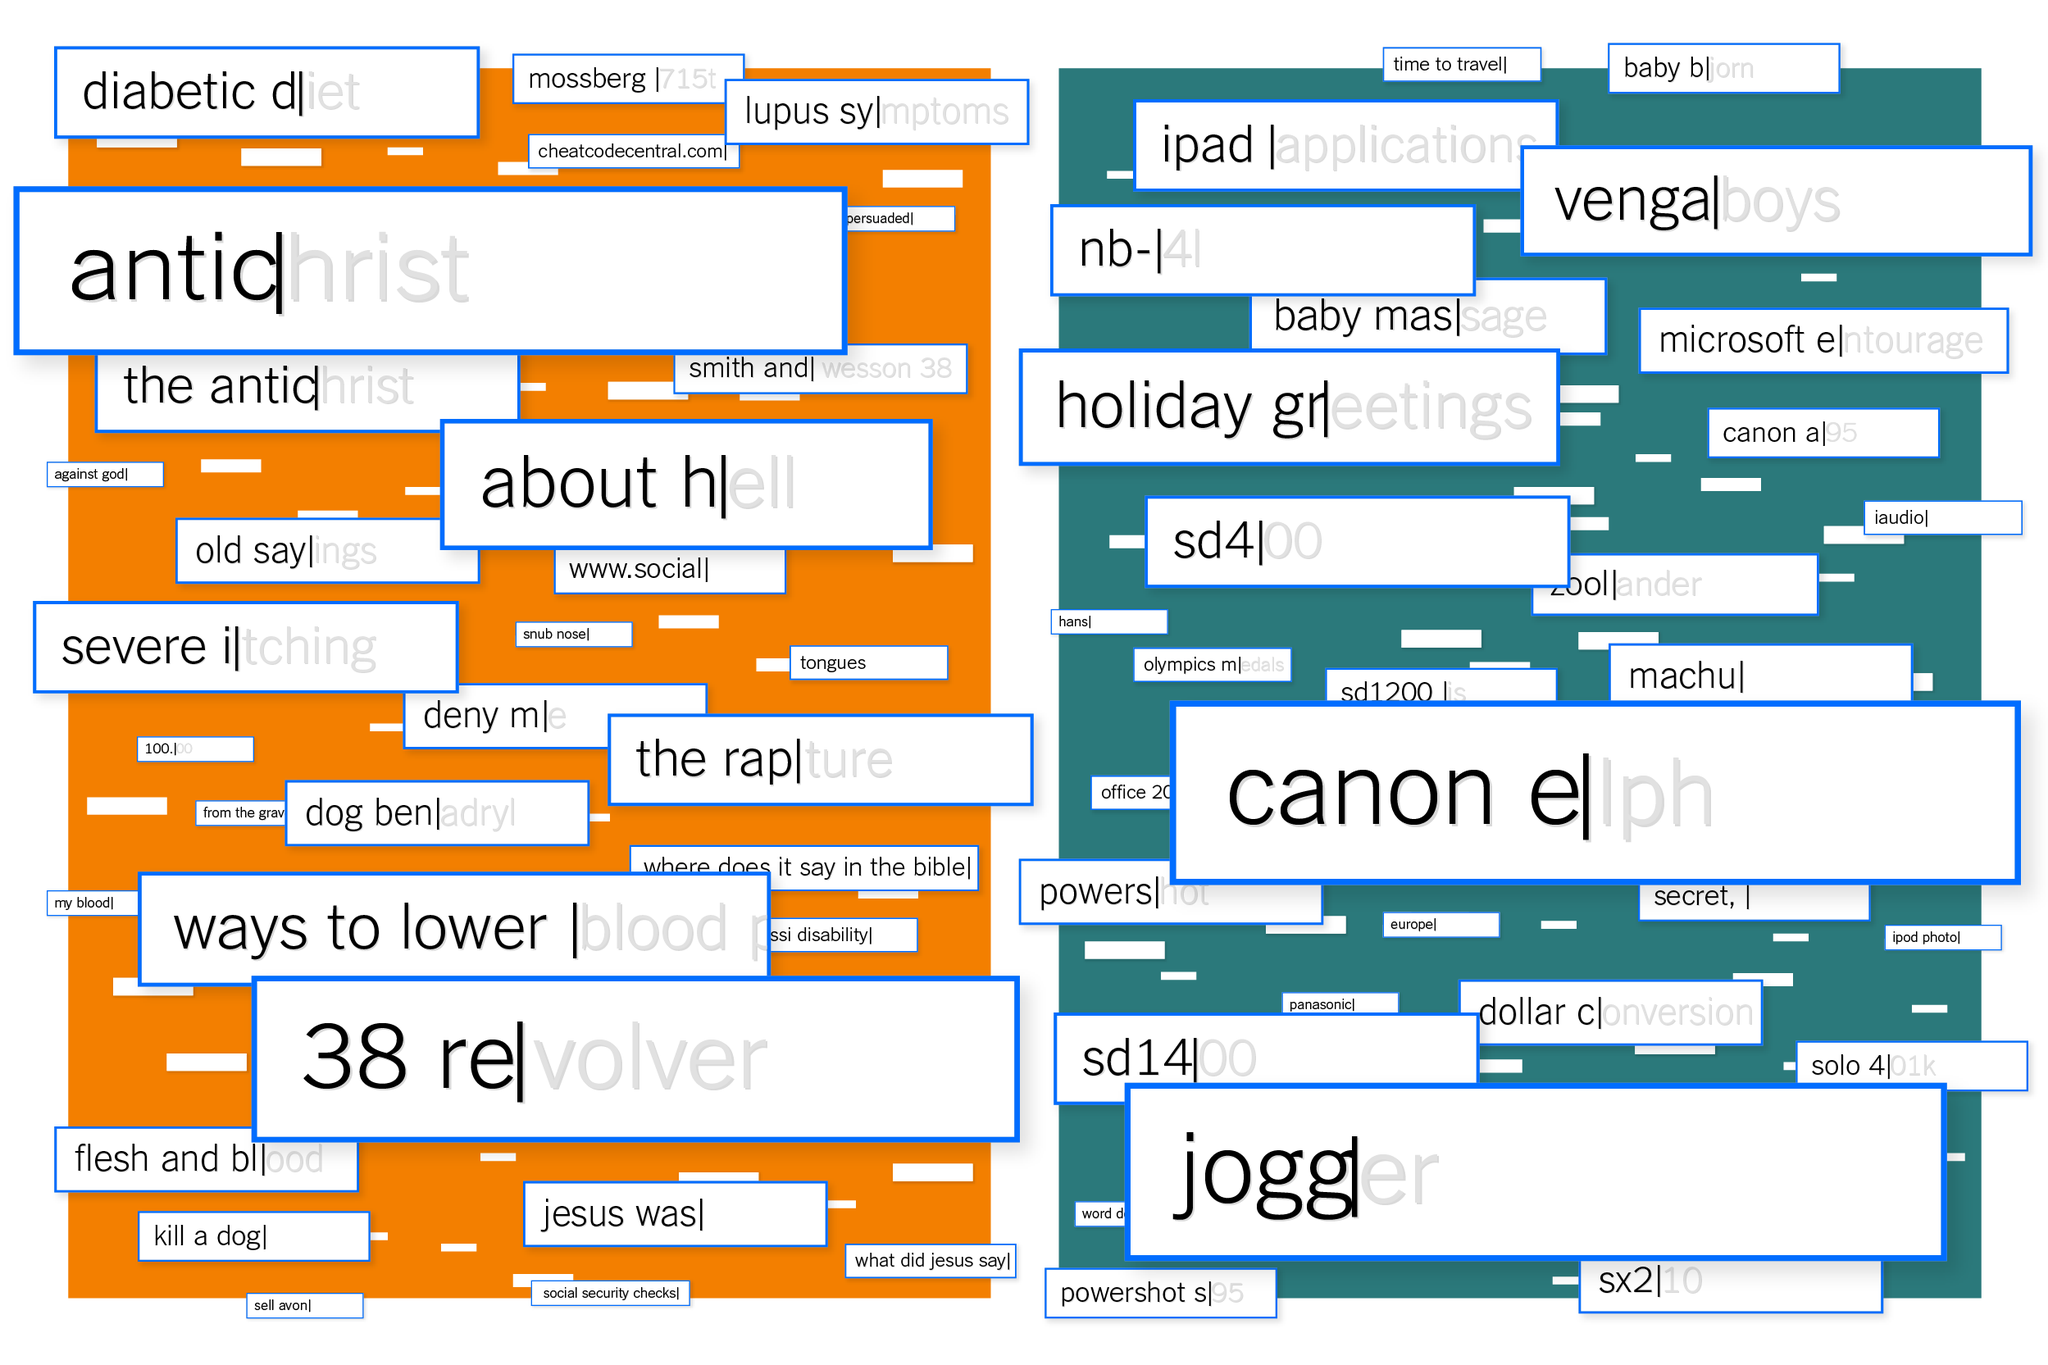
The Upshot in the New York Times has a nice article titled In One America, Guns and Diet. In the Otehr, Cameras and ‘Zoolander.’: Inequality and Web Search Trends by David Leonhardt (August 18, 2014). They combined data from Google on favorite searches by county with socio economic data to show what searches correlate with the richer and poorer areas. While few of the correlations are surprising they provide details that one wouldn’t think of. Not only are religious searches more common in poorer areas, but so are searches for “about hell” and “antichrist.” In wealthy areas by contrast they search for “holiday greetings” presumably because they are more likely to live far from family.

Ayway, a neat study that illustrates who the aggregation of different datasets can work.

DH 2014, Dagstuhl, and Exploiting Text

Over the last month I’ve been to a number of conferences that I have been writing conference notes on.

  • At the beginning of July I was at DH 2014 in Lausanne Switzerland where I gave a workshop with Stéfan Sinclair on Your Very Own Voyant, participated in some panels and gave a paper (also with Stéfan).
  • I was at a Dagstuhl around data science and digital humanities at the end of July. We had a fascinating conversation. I ended up in a workshop on the ethics of big data which is going to become yet something else I wish I had the time to study properly.
  • At the beginning of August I went to a workshop at Waterloo that was in honour of Frank Wm. Tompa, Exploiting Text. This workshop had speakers, including myself, who spoke to issues that Tompa was interested in from dictionaries to algorithms for text retrieval. I was often lost in the algorithm talks but it was fascinating to listen to a different view of text.

Text Analysis with Topic Models

TopicModelPlot

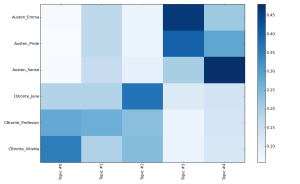
Fotis pointed me to this set of tutorials on Text Analysis with Topic Models for the Humanities and Social Sciences. The tutorials are built around Python, but most of it could be done with other tools. While I haven’t followed through the set of tutorials, they look like a great primer on text mining, visualization and interpretation. I particularly like how they include different datasets (British Novels, French plays …) to play with.

Topic Modeling and Gephi

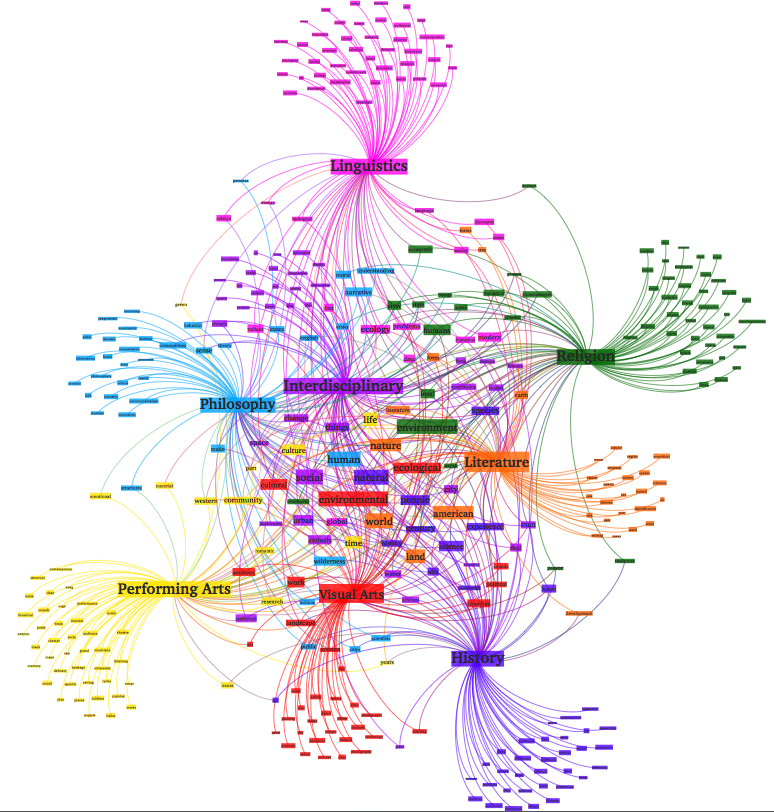
Veronica Poplawski has posted a nice blog essay on Topic Modeling and Gephi: A Work in Progress : Digital Environmental Humanities. She walks through a project she did on 358 Environmental Humanities documents related to a workshop I was part of in the Fall (see my conference report here.) First she used Mallet to generate topics and then she created an XML file to bring the topics and associated words into Gephi for visualization. Nice work!

Scopeware Vision Professional

I was reading about the Yale Lifestreams project which may have been one of the first life-tracking projects. Lifestreams was developed by Eric Freeman (it was his 1997 PhD project) and David Gelernter. They had some interesting ideas about how the computer should organize your data into streams rather than you having to file stuff. The streams could take advantage of the flow of your life. Here is how lifestream is defined:

A lifestream is a time-ordered stream of documents that functions as a diary of your electronic life; every document you create and every document other people send you is stored in your lifestream.

Freeman and Gelernter tried to commercialize the ideas through Scopeware released by Mirror Worlds. If you search Google Images for Scopeware you can see a number of screenshots that give an idea of how the interface organized files into streams.

Many of their interface ideas seem to have reappeared in things like Apple’s Cover Flow and Time Machine which explains why Mirror Worlds sued Apple (unseccessfully).

The idea is supposed to have come from Gelernter’s semi-philosophical book Mirror Worlds: Or the Day Software Puts the Universe in a Shoebox…How It Will Happen and What It Will Mean (1991) in which he reflects on the change from small personal software to large networked software that “mirrors” the world. Google Street View and all the virtual surrogates available on the web would seem to prove him right, though he may have been imagining more of a VR type implementation. (Admission: I haven’t read the book, just reviews.)

What intrigues me is the focus on time and the move away from representations of time as a line that traverses from left to right. In streams you are in time and can swim back like driving down a road to the past.

Around the World Conference

ATW_Logo

Today we are running the Around the World Conference from the University of Alberta. This year’s topic is privacy and surveillance in the digital age. The Kule Institute for Advanced Study is hosting this online conference. Here are some of my opening comments,

I would like to welcome you to our second Around the World Conference. This year’s conference is on Privacy and Surveillance in the Digital Age.

The ATW conference was the idea of the Founding Director of KIAS, Jerry Varsava. The idea is to support a truly international discussion around a topic that concerns us all around the world.

This year we have speakers from 11 countries including Nigeria, Netherlands, Japan, Australia, Italy, Israel, Ireland, Germany, Brazil, the US, and of course Canada.

This ATW conference is an experiment. It is an experiment because it is difficult to coordinate the technology across so many countries and institutions. It is an experiment in finding ways to move ideas without moving bodies. It is an experiment in global discussion.

International Ethics Roundtable 2014

Last week I was at a great little conference, the International Ethics Roundtable 2014. My conference notes are at Information Ethics And Global Citizenship. I gave a paper titled, “Watching Olympia”, about the CSEC slides that showed the Olympia system developed by the Communications Security Establishment Canada. You can see the blog entry that my paper came from here.

Text classification tool on the web


Michael pointed me to a story about how Stanford scientists put free text-analysis tool on the web. The tool allows you to pass a text (or a Twitter hashtag) to an existing classifier like the Twitter Sentiment classifier. It then gives you a interactive graph like the one above (which shows tweets about #INKEWhistler14 over time.) You can upload your own datasets to analyze and also create your own classifiers. The system saves classifiers for others to try.

I’m impressed at how this tool lets people understand classification and sentiment analysis easily through Twitter classifications. The graph, however, takes a bit of reading – in fact, I’m not sure I understand it. When there are no tweets the bars go stable, and then when there is activity the negative bar seems to go both up and down.

Interpreting the CSEC Presentation: Watch Out Olympians in the House!

The Globe and Mail has put up a high quality version of the CSEC (Communications Security Establishment Canada) Presentation that showed how they were spying on the Brazilian Ministry of Mines and Energy. The images are of slides for a talk on “CSEC – Advanced Network Tradecraft” that was titled, “And They Said To The Titans: «Watch Out Olympians In The House!»”. In a different, more critical spirit of “watching out”, here is an initial reading of the slides. What can we learn about how organizations like CSEC are spying on us? What can we learn about how they think about their “tradecraft”? What can we learn about the tools they have developed? What follows is a rhetorical interpretation.

Continue reading Interpreting the CSEC Presentation: Watch Out Olympians in the House!