Social Innovation

Last month the Province of Alberta proposed to create a Social Innovation Endowment to “help foster new, solution-oriented approaches to solving Alberta’s complex social challenges…”. The endowment fund will be $1 billion which should generate eventually $45 million a year towards research, knowledge dissemination and prototype partnerships.

As a government announcement from March 4th puts it, “Bill 1 creates the largest social innovation endowment in Canada…” This Social Innovation fund is not the first fund to support research. We have funds supporting medical research and scientific research: the Alberta Heritage Science and Engineering Research Endowment Fund (AHSER) and the Alberta Heritage Foundation for Medical Research Endowment Fund (AHFMR) and there are other smaller ones.

The Social Innovation fund, however, fleshes out a full suite of funds supporting research in Alberta. The U of Alberta President, Indira Samarasekera has praised the establishment of the Social Innovation fund for this reason. It is the “third pillar” of funding (after medical and scientific/engineering) that will support the social sciences, arts, and humanities.

This leads to questions about what is Social Innovation and  How to innovate. What could this fund support? How can humanists and artists imagine their research fitting under the rubric social innovation? To answer these questions I have put together a list of links and readings I found useful and will be supplementing it.

Wearable Computing


I just came across a chapter on Wearable Computing by Steve Mann (pictured above) from the Interaction Design Foundation. The chapter is part of a larger open Encyclopedia of Human-Computer Interaction. You can read it online for free or become a member of the organization and get a PDF or buy it.

Steve Mann is the researcher who has been working on wearable and bearable computing for decades. He has developed systems that I am told are better than Google Glass.

Research Collaborations: Where to start?

Today, I have to say a few words about collaboration at a lunch-time Arts Research Group gathering. I thought I would gather them here:

  • First, collaboration needs to be explicitly discussed to go well. Don’t assume that everyone knows who is doing what or that they share your sense of the goals. Err on the side of saying too much too often.
  • In some cases a formal charter is a good idea. The iterative design of a project charter for interdisciplinary research.
  • One thing you need to work out explicitly is how credit will be apportioned. Discuss it and then follow what you agree to. Always be generous with those with less power than you in the collaboration.
  • Collaborations are not necessarily friendships between like-minded folk. Collaborations often cross disciplines and research practices. Collaborations are often between people with different levels of support, power, and engagement. Try to share support with collaborators (if, for example, you get a grant.) Be ethical in your collaborations with those with less power. Be careful not to ask too much of those not engaged in the whole project.
  • If you want to collaborate with someone ask them. Invite them out for a coffee and explain what you want to do. Try to figure out how this would be useful for them and build that into the collaboration.
  • There are lots of tools you can use for managing communication and collaboration, but none of them are a substitute for regular attention. I frankly find a weekly meeting is the best way to keep things on track.
  • There is lots of advice our there on collaboration and even grants to facilitate developing collaboration. Developing a collaboration takes time, so avail yourself of support to do it.


Can You DIG It? 2014

The Humanities Computing Student Association is putting on a neat conference, Can You DIG It? 2014. The conference will take place on March 14th at the University of Alberta. There will be panels and workshops on:

  • Digging Mobile Media: Topics in Emerging Tech
  • Digging New Lines: Topics in Digital Mapping
  • Digital Representation: Women in Video Games
  • Hearing the Digital: Topics in Sound Art & Music

Find out more and register here.

Early Selfie (1865)

There was a discussion on Humanist about selfies and Emma Clarke on behalf of the Letters 1916 Project team posted a link to this holding of the National Library of Ireland, Augusta Caroline Dillon and Luke Gerald Dillon with camera on tripod reflected in a large mirror.

The two were apparently skilled amateur photographers who experimented with photographs like this. If one goes beyond photographs to paintings, I wonder if Las Meninas would qualify as a selfie.

Humanities Visualization Service at Texas

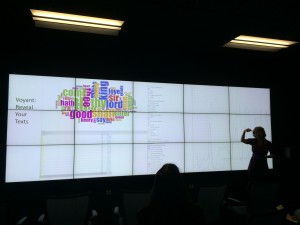
Texas A&M University held a Humanities Visualization Service Grand Opening at the Initiative for Digital Humanities, Media, and Culture. One of the visualizations they showed used Voyant (see above.) It is interesting to think about how visualizations should be designed for large screens seen by groups of people. With others I presented on this subject at the Chicago Colloquium – see The Big See: Large Scale Visualization. I am not convinced that very high-resolution screens/projectors and tiled data walls (like what they have at the IDHMC) will become the norm. We need to develop visualization tools so that they can scale up to walls and for groups.

Text classification tool on the web


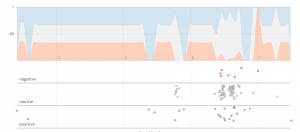
Michael pointed me to a story about how Stanford scientists put free text-analysis tool on the web. The tool allows you to pass a text (or a Twitter hashtag) to an existing classifier like the Twitter Sentiment classifier. It then gives you a interactive graph like the one above (which shows tweets about #INKEWhistler14 over time.) You can upload your own datasets to analyze and also create your own classifiers. The system saves classifiers for others to try.

I’m impressed at how this tool lets people understand classification and sentiment analysis easily through Twitter classifications. The graph, however, takes a bit of reading – in fact, I’m not sure I understand it. When there are no tweets the bars go stable, and then when there is activity the negative bar seems to go both up and down.