NovelTM: Text Mining the Novel

This week SSHRC announced the new partnership grants awarded including one I am a co-investigator on, NovelTM: Text Mining the Novel.

This project brings together researchers and partners from 21 different academic and non-academic institutions to produce the first large-scale quantitative history of the novel. Our aim is to bring new computational approaches in the field of text mining to the study of literature as well as bring the unique knowledge of literary studies to bear on larger debates about data mining and the place of information technology within society.

NovelTM is led by Andrew Piper at McGill University. At the University of Alberta I will be gathering a team that will share the resulting computing methods through TAPoR and developing recipes or tutorials so that others can try them.

Text Analysis with Topic Models

TopicModelPlot

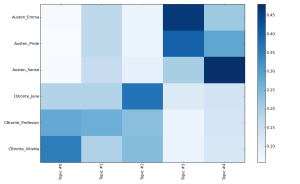
Fotis pointed me to this set of tutorials on Text Analysis with Topic Models for the Humanities and Social Sciences. The tutorials are built around Python, but most of it could be done with other tools. While I haven’t followed through the set of tutorials, they look like a great primer on text mining, visualization and interpretation. I particularly like how they include different datasets (British Novels, French plays …) to play with.

Topic Modeling and Gephi

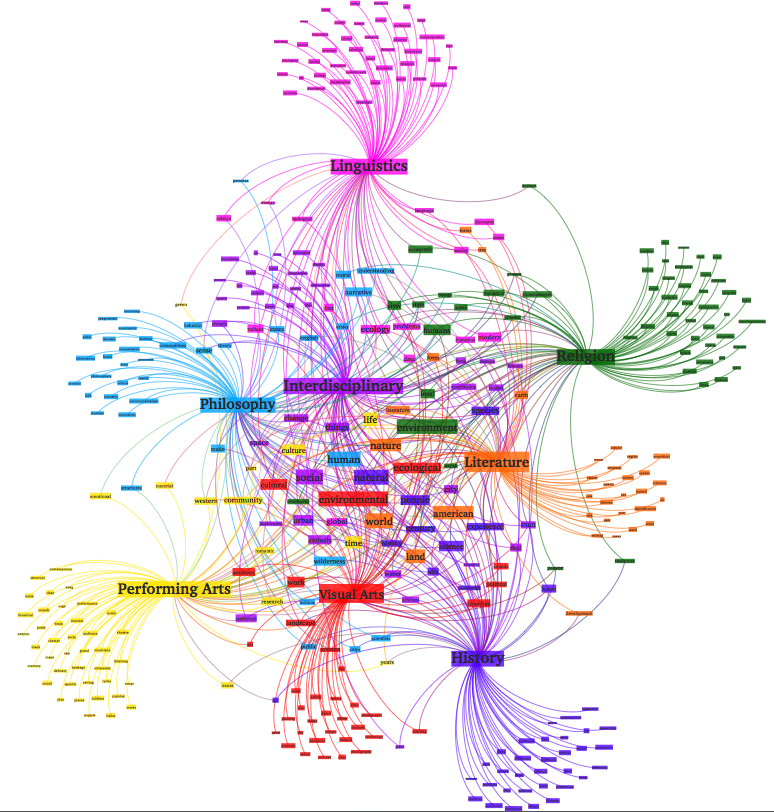
Veronica Poplawski has posted a nice blog essay on Topic Modeling and Gephi: A Work in Progress : Digital Environmental Humanities. She walks through a project she did on 358 Environmental Humanities documents related to a workshop I was part of in the Fall (see my conference report here.) First she used Mallet to generate topics and then she created an XML file to bring the topics and associated words into Gephi for visualization. Nice work!

Buxton Collection of Input Devices

PivotViewer

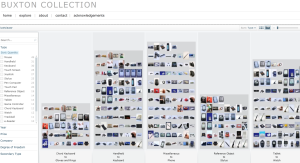
Bill Buxton has made available his collection his Buxton Collection of Interactive Devices. This collection of input and touch devices like chord keyboards, watches, pen computers, and joysticks. I saw some of his collection when at GRAND in 2011 as he mounted a display for CHI 2011 which took place right before.

What is doubly interesting is the Microsoft Silverlight PivotViewer which is for exploring large sets of visual objects. You can explore the Buxton Collection with Pivot if you install Silverlight. Apparently Pivot is discontinued, but you can still try it on the Buxton Collection.

The interface of the PivotViewer reminds me of Stan Ruecker’s work on rich prospect browsing. He developed an interface that always keeps the full set of objects in view while drawing some forward and minimizes others.

Fragmented Memory | Phillip Stearns

From Elijah Meeks’ hackathon at the Texas Digital Humanities Conference I learned about Fragmented Memory by Phillip Stearns. This is a project that takes binary data and then turns it into weaving instructions using Processing. Here is one of the large tapestries woven (and available for sale.)

If you can’t afford a $15,000 tapestry, there are also cheaper blankets here.

I’ve just put them on my Christmas list (which I can never find in time.)

Humanities Visualization Service at Texas

Texas A&M University held a Humanities Visualization Service Grand Opening at the Initiative for Digital Humanities, Media, and Culture. One of the visualizations they showed used Voyant (see above.) It is interesting to think about how visualizations should be designed for large screens seen by groups of people. With others I presented on this subject at the Chicago Colloquium – see The Big See: Large Scale Visualization. I am not convinced that very high-resolution screens/projectors and tiled data walls (like what they have at the IDHMC) will become the norm. We need to develop visualization tools so that they can scale up to walls and for groups.

Data Visualization: Looking back, going forward

D-Lib Magazine has a Featured Digital Collection in this issue. See the right-hand column of the Table of Contents for January/February 2014. The featured collection is DataVis.ca, a terrific site about visualization that has been organized by Michael Friendly at York University. The site is nicely organized and pays attention to the history of visualization. (The image above is the “first (known) statistical graph – from 1644 by Michael Florent van Langren.)

I’m not only impressed by the DataVis.ca site, but also that D-Lib is featuring sites, something I didn’t notice before. This is a nice way to recognize work (web archives) that are difficult to formally review.