Shawn Day on his Randomosity blog has links to some good explanations of the Soundex algorithm for finding names that sound the same, but are spelled differently as in “Smith” and “Smythe”. For example, Eastman’s Online Geneaology Newsletter has a post on Soundex Explained that walks you through the algorithm.
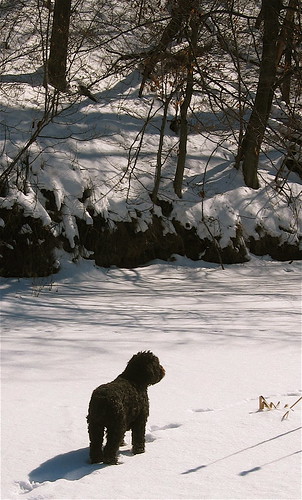
Cootes after the storm
 Well I got myself a Flickr account for the photos I take. I’m tired of hand coding albums.
Here is a set of photos I took on a hike in Cootes after the storm we had this week. Snow has smothered the hills so softly that everything is pushing back through.
If I were Prime Minister…
 Last night I went to hear David Suzuki at his Hamilton stop to the If YOU were Prime Minister… tour. This is a 50 city tour to “turn concern into concrete action”. Here in Hamilton the event was held in Hamilton Place which was close to full. In the lobbies there were displays from local ecological and political action groups. There was thus both large scale mobilization (Suzuki asked us to “vote” for the environment by filling out a card/petition for Ottawa) and there was local mobilization. He asked us to take the Nature Challenge, “10 easy life tweaks”.
One of the interesting points Suzuki made was that widespread concern about the environment is not new, the problem is getting concrete action. In 1988 there was a similar groundswell of concern, but politicians despite lip-service, didn’t deliver change. “If YOU were Prime Minister…” is about mobilizing us to concrete action at the local, national, and international level. It is about keeping an accountable focus on the environment.
So, what would I do if I were Prime Minister? First, I would develop a program that encourages communities to implement traffic calming so that our communities are more livable and not transportation corridors. I love the idea of the woonerf – Dutch for “living street”. For an extreme take, see Why don’t we do it in the road? by Linda Baker. Second, I would develop a national road toll system so that commuters have to pay for using all highways. The funds raised would go directly to public transportation along the corridors where the tolls are raised. The more traffic, the more funds for public transportation. This might work as traffic calming on the large scale. The idea would be to retake our streets and fund alternatives to highway use, two initiatives that would affect the carbon dioxide emissions from transportation, a major contributor to greenhouse gas emissions.
Facebook Ethics
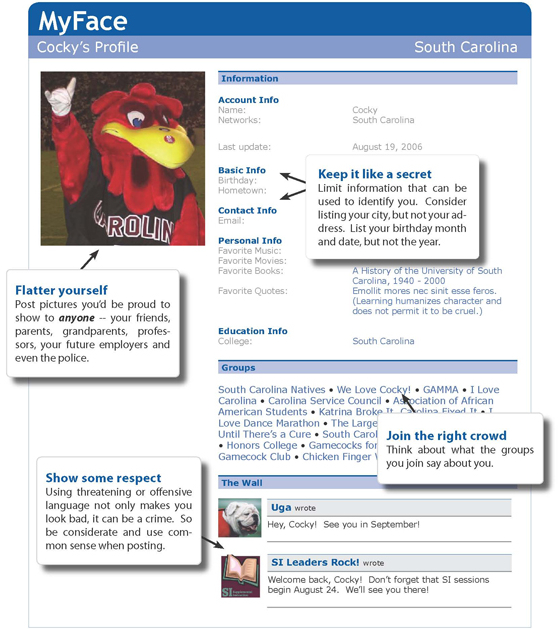 As I’ve been getting invited to become the “friend” of students and colleagues on FaceBook (I now have 91 friends) I have been reflecting on the ethics of representation on Facebook. The Silhouette has a story about the Unlucky seven Community Advisors who were fired after pictures showed up on FaceBook with them drinking while on duty. Inside Higher Ed has a story, Dental Pain at Marquette about a student disciplined for blog entries that didn’t fit the code of ethics. This raises the question of whether universities are developing their student codes to provide guidance about how to behave on the web. The closest I can find (after a quick Google search) is a very reasonable guide from the University of South Carolina, titled, Let’s face it. The guide suggests that students:
- Keep information that can identify you secret
- Post pictures that “flatter” rather than embarassing pictures that you wouldn’t want parents to see
- Show respect in wall posts
- Join the right groups – think about how they reflect on you
The other side of the equation is what should parents and profs do when we come across inappropriate material on FaceBook. I feel a little like I am eavesdropping on private conversations and should back out. To paraphrase the Marquette Dental School’s ethicist quoted in the Inside Higher Ed article, “It’s FaceBook. It is what it is and we shouldn’t take it out of context.”
Kids, the Internet, and the End of Privacy: The Greatest Generation Gap Since Rock and Roll
Now here’s an interesting idea. Kids, the Internet, and the End of Privacy: The Greatest Generation Gap Since Rock and Roll, by Emily Nussbaum, is the lead article in New York Magazine (Feb. 12, 2007 issue) and it’s about the new generation gap between our students and us. They have no problems smearing themselves all over the web, we worry about our privacy.
More young people are putting more personal information out in public than any older person ever would and yet they seem mysteriously healthy and normal, save for an entirely different definition of privacy. From their perspective, it’s the extreme caution of the earlier generation that’s the narcissistic thing. Or, as Kitty put it to me, “Why not? What’s the worst that’s going to happen? Twenty years down the road, someone’s gonna find your picture? Just make sure it’s a great picture.”
We worry about how their life stories (and pictures of them on Facebook drinking) will be misused. They assume people will understand the context and understand them better. Perhaps if everyone is doing it they will be private in the crowd. Or they will realize their parents and profs are getting into Facebook and move off.
The Exchange Online
Robert Townsend has a Review of the ACLS Cyberinfrastructure Report in the The Exchange Online of the Association of American Universtiy Presses. He is critical of the report, arguing,
To make its case, the commission simply ignores skeptics who ask whether the rush to mass digitization could hurt reading and scholarship, and whether there might be other casualties on this road to progress. This offers a rather narrow view of the “grand challenges” facing the humanities and social sciences, and limits the array of problems that might be remedied by a developed cyberinfrastructure. This seems part of a larger rhetorical strategy in the report, however, which positions potential problems and the costs of digitization as external to its vision of technological progress—limiting them to social, political, or financial failures that can be assigned to publishers and “conservative” academics.
He rightly points to the ongoing costs of maintaining digital projects, “Like Jacob Marley‚Äôs chains, link-by-link we forge these digital burdens that we can never seem to lay down.” (Great image.) He is worried about the place of non-profit publisher who might get left behind if there is massive investment in cyberinfrastructure that goes to the universities who then cut out the publishers. I’m tempted to say that this is an old refrain, but that doesn’t make the issue go away. Frankly I doubt cyberinfrastructure investment will endanger quality publishers, but it may change their relationship with the academy. More importantly I think the Report (see previous blog entry) was making the case for investment in humanities and arts cyberinfrastructure so we can do our research, including research around digital publications.
YouTube: Web 2.0 … The Machine is Us/ing Us
Web 2.0 … The Machine is Us/ing Us is a great short (4.3 minutes) video on digital text, hypertext and XML. It makes the point about how XML and tagging enrich text with knowledge that can be manipulated in innovative ways. The video does this by showing the editing of text where what is typed is the message and demonstrates the message. This is by Michael Wesch, a Cultural Anthropologist at Kansas State. See the Digital Ethnography group blog his is part of.
Thanks to Terry for this.
Ada: The Enchantress of Numbers
 Ada: The Enchantress of Numbers is a biography of and selection of Ada’s lettes by Betty Alexandra Toole (Mill Valley, CA: Strawberry Press, 1998). The work is, as the author writes in the Acknowledgements, “the result of more than twenty years of addiction to Ada.” (page ix) This addiction shows itself in, for example, Toole’s e-mail, “adatoole at well dot com”. Toole seems concerned to protect Ada from claims that she was a drug addict and addicted gambler, though she doesn’t so much argue the case as unleash it. The paperback version (and hardback) is published by Strawberry Press: “Strawberry Press publishes reference books for the succulent world …” and much is made of the cover designer, Leah Schwartz (whose book, Leah Schwartz, the life of a woman who managed to keep painting was also published by Strawberry Press.) I’m not sure I would keep painting covers like the one for Ada.
Despite the strange presence of the author/editor and cover designer, the book nicely gathers Ada’s letters and her notes on Babbages Analytical Engine with biographical context. The correspondence with Babbage is startling as it is clear how firm Ada was with Babbage about her publication of the translation and notes (she refused to let Babbage append a rant about funding and almost fell out with him over this). The annotated selections from her notes on the Analytical Engine also make clear how they were an original reflection on the Engine. I’m curious now about what they thought “analysis” was then.
What comes through about her personality is that she was a brilliant woman, constantly sick, struggling with her mother (who pushes her into mathematics), and socially connected to many of the leading scientists and mathematicians (like Babbage) of the day. Her last months as documented by Toole are heartbreaking.
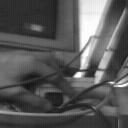
BBC: Fifteen years of the web
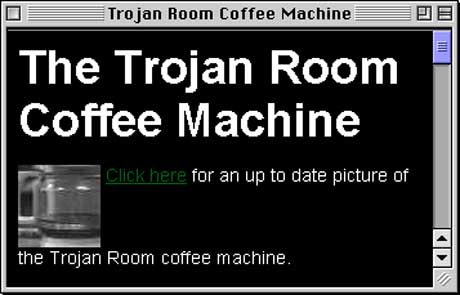 The BBC has a nice interactive timeline on Fifteen years of the web. It includes such “firsts” as the first webcam to go online – watching a coffee pot at Cambridge University (picture of it being disconnected here). Apparently the coffee percolator went offline in 2001 and was sold to Speigel (who seem to have put it, or another one, back online.)
I suspect that dot.com crash was due to a lack of coffeecams. The timing of the disconnection is suspect.
State of the Union Parsing Tool
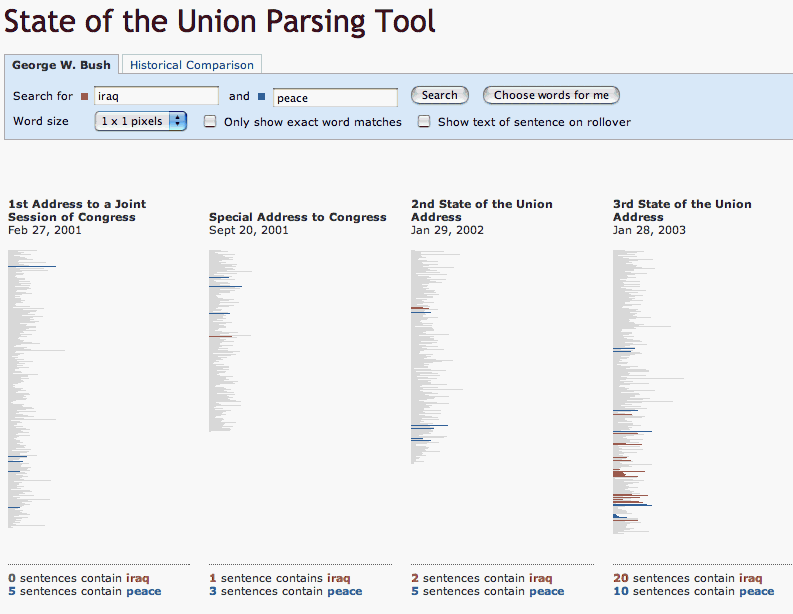 Yet another George W Bush, State of the Union visualization tool can be seen at State of the Union Parsing Tool. I commented earlier on the New York Times, State of the Union in Words. It seems that Bush’s State of the Union addresses are becoming the standard text for visualizations.
This one on Style.org colorizes the lines with the found words. You can set the size of the words (and therefore text representation.)