
Stan pointed me to “an exquisite jQuery plugin for magical layouts” called Isotope. It allows you to have a layout of items (images of web sites or blocks of information) that can be rearranged with nice animations.
Stan pointed me to “an exquisite jQuery plugin for magical layouts” called Isotope. It allows you to have a layout of items (images of web sites or blocks of information) that can be rearranged with nice animations.
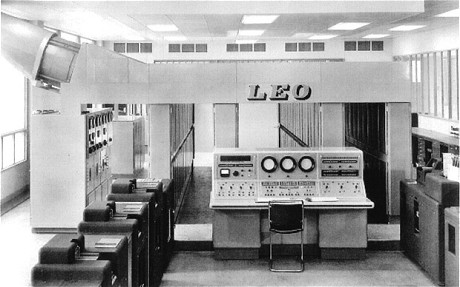
The Telegraph has a nice story about how How a chain of tea shops kickstarted the computer age (Christopher Williams, Nov. 10, 2011.) The story is about the 60th anniversary of the LEO which could be considered the first business computer. LEO was developed by the catering company J Lyons and Co which operated tea shops.
We came across an article in the Globe and Mail from Sept. 16, 1955, “Britain Leads in Office Automation” that talks about Ferranti and Leo. The article mentions that they and others “have not experienced much, if any, labour antagonism.” Automation putting people out of work was a major issue in those early years.
The Telegraph story sent me to a YouTube video of a BBC broadcast on the LEO that goes into fascinating detail about how it is “programmed” in hardware. They go from design to hardware as this is not a general purpose system that can be programmed in software.
Much of the discussion around the games industry here in Japan is taken up by the difficulties big companies like Nintendo are going through. Given that the big companies dominate the scene and that game studies here pay a lot of attention to industry, this means that most discussions with games researchers eventually circle around to the downturn in the industry and what Japan can do about it. But, what exactly is the problem with the Japanese games industry? Here are some of signs that worry games researchers here:
There is another side to the story. As Ashton Raze puts it in a the Telegraph Super Mario 3D Land review (Nov. 18, 2011),
While current talk of Nintendo is often mired in share prices and falling stocks, it’s easy to forget that they also make games like this; joy-filled, effortless romps, pure blue-sky gaming that can easily be hailed as the reason to own a given system.
Nintendo has also been here before. Osamu Inoue in a somewhat enthusiastic book Nintendo Magic documents how Satoru Iwata (the current president of Nintendo) led the company to record profitability after the poor performances of the Virtual Boy, N64, and GameCube. Eventually they got it right with the DS and Wii. Nintendo has the cash reserves and creativity reserves to weather poor years and systems that aren’t hits. The question is whether a strategy of focused on selling tightly coupled systems and software will work now that smartphones are powerful enough to be mobile systems, and gamers are moving to casual social games and large-scale virtual game worlds all playable on PCs? Who needs dedicated mobile systems or consoles?
Some of the questions that come up when we discuss the perceived downturn are:

There are small themed bars in all the Japanese cities. They can by 7 floors up by elevator with a little billboard on the street or down a corridor off a back alley with nothing to advertise the bar on the street. Café la siesta is just such a bar in Kyoto dedicated to the generation of 8-bit games like the NES.
I have posted a large set of photographs about Den-Den Town, also known as Nipponbashi. This is a neighborhood of Osaka that I visited with Jaakkoo Suominen especially to see the retro-gaming stores where you can buy old game systems and games.
I’m slowly going through the images and annotating them and I’ll probably go back with more specific questions. I took a couple of the eroge (erotic games) because there were so many and it is so clearly a big part of the game industry here in Japan (see this article on Dating simulator games inspire legion of followers – and detractors.) I have blurred out any details of private parts for the sake of decency.

I also took photographs of other things as we worked our way from game store to game store including the picture above of the street person on the main street with their belonging tidly packed up under a tarpaulin. I was struck by the contrast between the busy stores full of old toys and the man peacefully sleeping there in Den-Den town.
How do Japanese researchers see the globalization of games? As I mentioned in my last post, games researchers in Japan are negotiating their field and how it will intersect with game studies elsewhere. While there seemed to be a consensus that they needed to be sufficiently fluent in English to both read and publish in English (the way engineering or medical researchers here do), they don’t see globalization the way we do. First of all games research here is much more interested in supporting industry than game studies in the West. What they call game studies here spans both what we call game studies and the work done in computer science, engineering, and business that work closely with industry. Game studies here is imagined to be supportive of industry in the sense that it should produce well trained students and their research should benefit industry. By contrast, game studies in the West like many humanities and social science fields, is imagined as needing a critical relation with industry. I will be looking more at the relationship with industry in other posts as it came up in many interviews, for the moment let me draw attention to the importance of Asia to Japanese game studies. Japanese youth culture exports well to Asia giving Japan “soft power” in the region, but Japan is also beginning to outsource content creation to countries like China where animators are cheaper. As one can imagine, Asia is Japan’s neighborhood historically, culturally and now economically in a way that it is not for Canada. One of the experts here in Japan on the Asian game market is Professor Nakamura.
Continue reading RCGS Part 3: Game studies beyond Japan and other issues
From a story in the Guardian I discovered that online reading is taking off in China. According to China Daily story, Web literature turns a page with profitable storyline a large percentage of Chinese web users are reading long serialized novels for a 30-50 cents per 100,000 words (which is about a dollar for every 600-1000 pages!) The Guardian story Has China found the future of publishing? suggests that the convenience, the price, the type of serialized literature, the economic model (of independent authors and commercial sites), and the proliferation of e-readers has made it a viable business. I’m guessing that serialization is a way of discouraging pirates – people who want the next chapter will pay to get it as soon as possible.

What is the state of game studies in Japan? The inaugural conference of the Ritsumeikan Center for Game Studies (RCGS) that I blogged about before, had a session titled “Game Studies in Japan: Past and Future” that was dedicated to introducing game studies in Japan to the Ritsumeikan audience through speakers invited from other universities. While one session with three speakers hardly covers the variety of game studies in Japan, it (and the discussion that followed) were my introduction to how the Japanese talk about the field among themselves.

Note: This is the first in a series of blog posts about Japanese Game Culture and Game Studies. Thanks go to the support of GRAND, The Ritsumeikan Art Research Center and the Japan Foundation.
Part 1: Setting the Scene
What better way to introduce game studies in Japan than to describe the Game Studies in Progress symposium held to celebrate the inauguration of the Ritsumeikan Center for Game Studies (RCGS). As I was in town thanks to support from the Japan Foundation, I was invited to be one of the guest speakers at a half-day conference on October 14th that kicked off the new center. The creation of the RCGS, which might also be translated “Ritsumeikan Games Research Center,” is one of the outcomes of a major research investment on the part of the Japanese government in a Digital Humanities Center for Japanese Arts and Culture.
The conference was held at the Art Research Centre building of Ritsumeikan University in a special room outfitted with a motion capture system and a sprung-wood floor suitable for Noh performances. One of the research groups of the Digital Humanities Center is the Digital Archives Technologies Group that is experimenting with ways of digitizing cultural heritage traditions like the Japanese Tea Ceremony or Kabuki. These traditions challenge classical Western ideas about what constitutes heritage. There are no archaeological digs, cathedrals or paintings to digitize when trying to preserve Bunraku puppet theatre; instead it is a tradition of oral teaching and performance that they are trying to support through digitization. So there we were in this special room dedicated to a 1000-year old art inaugurating the first explicitly named game studies centre. We were reminded of this as the floor was covered, we all had to leave our shoes at the front (something unusual for university buildings in Japan though common in houses and shrines) and we were reminded not to bring in any food or drinks. It was as if we were in a Zen temple to talk about that most postmodern of subjects, the videogame.
To accommodate the two foreign speakers – myself and Professor Jaakko Suominen of the University of Turku Finland, they had kindly found the extra funding for the translation services described above. For two of us they had a team of at least three translators and staff! Not for the first time I was awed by the hospitality of my hosts. Not for the first time I don’t feel worthy. Not for the first time I feel like a bit of fraud on a paid vacation to learn about Japanese game culture when there must be better cultural interpreters out there. I reassure myself by immersing myself every day so I can reflect some of this back to readers and that’s what these blog posts are about.
A word of warning, Suominen and I listened through earphones to a simultaneous translation of the talks in Japanese which means that I may not have accurately understood everything said. Again, language is one of the problems cross-cultural researchers in game studies have to overcome and it came up at the conference over and over, but more on that later. For this first entry, however, let me introduce the opening speaker, Professor Uemura pictured here.

Opening by Professor Uemura, Director of the RCGS
Professor Uemura is best known as the lead engineer who led the development of the Famicom which was called the Nintendo Entertainment System (NES) in North America. Uemura, who is still a consultant with Nintendo, kicked off the conference by talking about the variety of research taking place already at Ritsumeikan and his dreams for the centre. He listed some of the objectives for the center:
Professor Uemura then surveyed the types of research already taking place at Ritsumeikan:
Professor Uemura himself is studying game play on the Famicom looking for patterns in play. He has a set up which allows him to record input and output from a game while also capturing what is on the screen and video of the player. With this he can then look at rhythms of play and compare play.
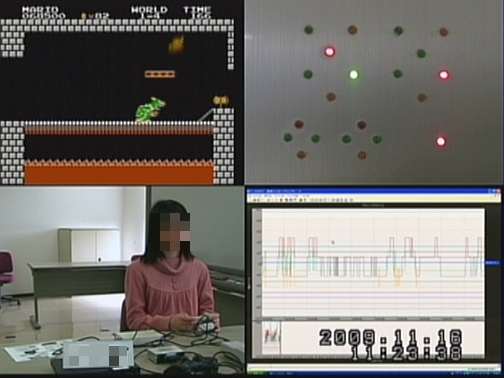 Slide showing the game play capturing system developed by Uemura (from a talk in Japanese)
Uemura concluded by emphasizing that he wants the RCGS to be a place for play – a place for fun and entertainment with games not just the serious study of games. Games should be fun he said, so games research should be fun. The idea is not research for the sake of research, but a research centre that is like an arcade. In his experience the difference between industry and academy is that in industry people have fun at what they are doing and he hoped that would be true of the RCGS too.
It is worth noting that there was an excitement to the symposium and generally an openness not always found elsewhere. The feel of the symposium was that participants were at the birth of something that they could participate in as game studies is just gaining academic credibility in Japan. As others pointed out game studies in Japan is just in its infancy which for the participants means that there is none of the unwelcome turf wars we see in game studies in the West. In Japan they seem to have missed the ludology vs. narrativity battles.
Next: Part 2: Games Research in Japan
While I couldn’t attend, the Edmonton Dorkbot had a live coding event organized by Scott Smallwood. See Vadim Bulitko’s photos at Edmonton Dorkbot, Oct 11 (click the links to go to the YouTube videos).