
Erik pointed me to the WikiMindMap, a tool for visualizing topics in the Wikipedia and navigating them. It uses the mind mapping visual paradigm you see in thinking tools, see previous blog entry.
Erik pointed me to the WikiMindMap, a tool for visualizing topics in the Wikipedia and navigating them. It uses the mind mapping visual paradigm you see in thinking tools, see previous blog entry.
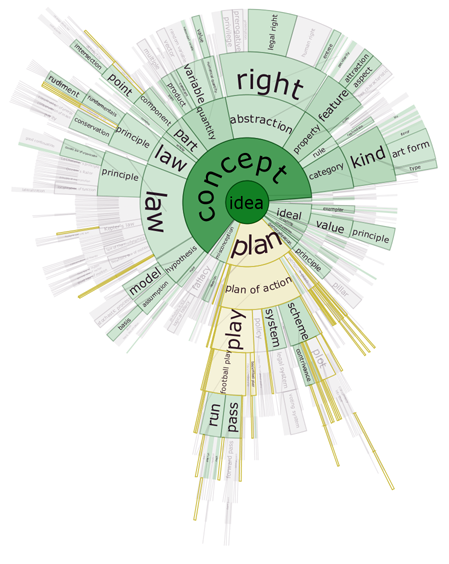
Ian pointed me to a cool visualization project by Collins and colleagues at UOIT called Docuburst. Docuburst uses WordNet and visualizes the distribution of words in a WordNet tree starting from a node you select. Their code is made available.
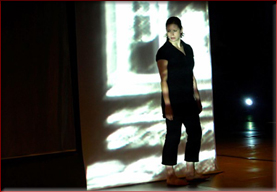
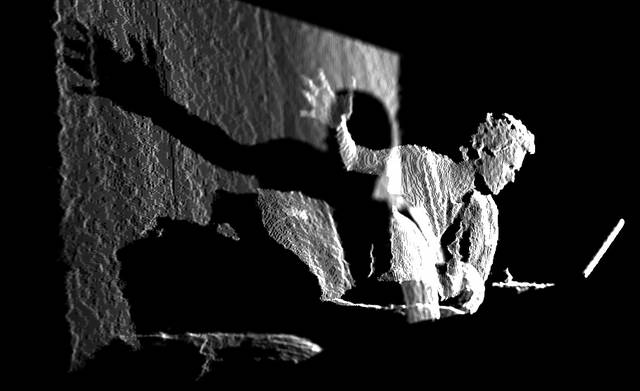
Folks in the Interactives Lab introduced me to Troika Ranch a dance team that performs with multimedia. You can see examples of what they do on their YouTube channel or on Net Television. They have created a real-time media tool called Isadora:
Isadora is the award-winning, graphic programming environment for Macintosh and Windows that provides interactive control over digital media, with special emphasis on the real-time manipulation of digital video.
Because every performance or installation is unique, Isadora was designed not to be a “plug and play” program, but instead to offer building blocks that can be linked together in nearly unlimited ways, allowing you to follow your artistic impulse.
There is a lot of excitement about the Microsoft Kinect and the potential for adapting their vision technology. Wayne sent me a link to this Music Motion Noise blog entry on Kinect Hacking and Art Round Table: Why it Matters, What You Need to Know.
Time to get one.
The next big idea is data according to a New York Times article, Humanities Scholars Embrace Digital Technology by Patricia Cohen (November 16, 2010.) The article reports on some of the big data interpretation projects like those funded by the Digging Into Data program like the Mining with Criminal Intent project I am on.
Members of a new generation of digitally savvy humanists argue it is time to stop looking for inspiration in the next political or philosophical “ism” and start exploring how technology is changing our understanding of the liberal arts. This latest frontier is about method, they say, using powerful technologies and vast stores of digitized materials that previous humanities scholars did not have.
I’m not sure this is a new generation as we have been at this for a while, but perhaps the point is that the new generation is now looking away from theory towards the large-scale data issues.

What stands out about the projects mentioned and others is that the digital humanities and design fields are developing new and subtler forms of large-scale data mining and interpretation that use methods from other disciplines along with a sensitivity to the nature of the data and the questions we want to ask. The image above comes from Stanford’s Visualization of Republic of Letters project. There is nothing new about visualization or network analysis, but digital humanists are trying to adapt methods to messy human data – in other words interpreting the really interesting stuff so that it makes sense of something to someone.
Perhaps we may be able to show that following theses are true and important to the broader community:
Thanks to Judith for pointing me to this NYT article.

I came across this example of text analysis in the wild using a wordle, Steve Jobs’s Android Obsession Analyzed. The short article is by David Zax in Fast Company (October 19, 2010.) Based on “Android” coming up as the highest frequency content word Zax reads obsession.
So yes, the Android weighs heavily upon Jobs’s mind; and his dreams are more than likely populated with ravenous green robots consuming everything in their path.
Stéfan pointed me to the AlchemyAPI service. AlchemyAPI provides an API for extracting “information about people, places, companies, topics, languages” and concepts. They have a nice demo on the front page where they take a news a top news story, extract the entities and then create a spring-loaded graph of the named entities.
 You can see that for this story the system found organizations, a city, countries and persons.
A free API key is available for up to 30,000 calls a day.

I came across an artist, Sam Winston, whose work often explores language. For example Darwin (see image above) compares Darwin’s On the Origin of Species and Ruth Padel’s Darwin, A Life In Poems.

Some of the panels/pages in Darwin are visualizations, even if hand drawn.
Many of his other works also play with language and language artifacts like Folded Dictionary.

50 Great Examples of Data Visualization is a nice summary of some of the most interesting visualizations. The emphasis seems to be on aesthetics rather than information exploration, but it is none-the-less a good place to start.
Thanks to Jean-Guy for this.

Judith sent me a link to a neat World Cup 2010 Calendar by MARCA.com. It provides a circular interface to all the different angle into the calendar of games for the World Cup.