The Garden of Error and Decay

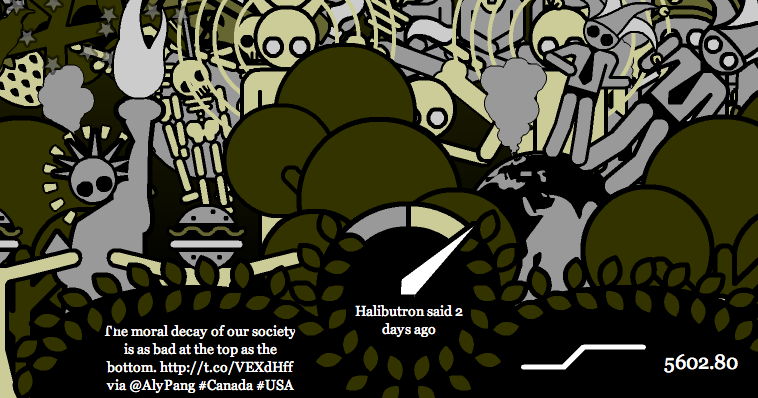
The Garden of Error and Decay is a real-time visualization of disasters mentioned in Twitter and other feeds. The text about the interactive says “this innovative moving image format is something like a real-time data driven narrative. This project is not a film, not a game, and not a nonlinear interactive story.” The visualization uses pictograms that represent the type of disaster. You can see the original twitter text.

Thanks to Scott for this.

Father Busa is dead

From Humanist I just found out that Father Roberto Busa has died. See Stop the reader, Fr. Busa has died in L’Osservatore Romano (English) or Morto padre Busa, è stato il pioniere dell’informatica linguistica from the Corriere del Veneto (Italian). Father Busa was a pioneer in humanities computing who started a project in the 1940s with help from IBM to create a complete concordance of Acquinas. The Index Thomisticus was arguably the first (big) humanities project to benefit from computing methods. For that reason the author of Stop the reader argues that,

If you surf the Internet, you owe it to him and if you use a PC to write emails and documents, you owe it to him. And if you can read this article, you owe it to him, we owe it to him

While it may be an exaggeration to say that we owe hypertext and the web to Father Busa, he was certainly one of the first to use computers to manipulate texts on a large scale. He saw the

Father Busa was also involved in developing the humanities computing field which is why we have named a prize after him. (See ADHO Roberto Busa Award). He wrote articles for journals like CHUM and Literary and Linguistic Computing. He was generous with his time and ideas. He was influential in Italy; others will know more about this. I met him in 1998 at the ACH/ALLC conference in Debrecen, Hungary where he was awarded the first Busa Award. As I speak Italian I was asked to join an executive dinner and had a pleasant evening talking about his ideas about hermeneutical text analysis which he delivered in his Award talk and which were later published in “Picture a Man …” in Literary and Linguistic Computing (14:1, 1999). At the end of his talk he played with the Cinderella metaphor for interpretative text analysis,

Metaphor is a linguistic phenomenon: when the name of one reality is chosen to signify another and different reality, because of some similarity between the two. I in fact applied the name of Cinderella to hermeneutical informatics, the two having in common youth, health, beauty, and poverty. Cinderella eventually got married to a prince. (p. 8)

Busa was a prince or perhaps a Cinderella who has now left the party.

Digging Into Data, Day 2: Making Tools and Using Them

I just discovered (thanks to the Digging Into Data site) that the Chronicle of Higher Education Wired Campus Blog has a nice story on the Digging Into Data Challenge Conference (2011) that talks about the Criminal Intent project I am on. See Digging Into Data, Day 2: Making Tools and Using Them. The article nicely summarizes Steve Ramsay who was our respondent to the effect that,

Mr. Ramsay’s talk celebrated how this kind of Big Data work can enhance rather than diminish the humanities’ traditional engagement with human experience. “The Old Bailey, like the Naked City, has eight million stories. Accessing those stories involves understanding trial length, numbers of instances of poisoning, and rates of bigamy,” he said in his response. “But being stories, they find their more salient expression in the weightier motifs of the human condition: justice, revenge, dishonor, loss, trial. This is what the humanities are about. This is the only reason for an historian to fire up Mathematica or for a student trained in French literature to get into Java.”

The article is by Jennifer Howard and was published June 12, 2011. This nicely contrasts with the Nature article on the event that focused on the culturnomics keynote by Erez Lieberman-Aiden & JB Michel from Harvard rather than the serious work of digging into data. You can see my earlier post on this conference (with a link to my conference report) here.

From Metadata to Linked Data Summer School | Digital Humanities Observatory


This week (July 4th, 2011) I’m instructing at the From Metadata to Linked Data Summer School at Trinity College, Dublin. I’m teaching a half-day hands-on workshop on Voyeur. You can see my workshop script here. I am trying a new version of our workshop script which will include worksheets.

I’m writing my notes at http://www.philosophi.ca/pmwiki.php/Main/FromMetadataToLinkedData – these are not a conference report so much as reflections on stuff I’m learning.

Digital Humanities 2011: Big Tent Digital Humanities

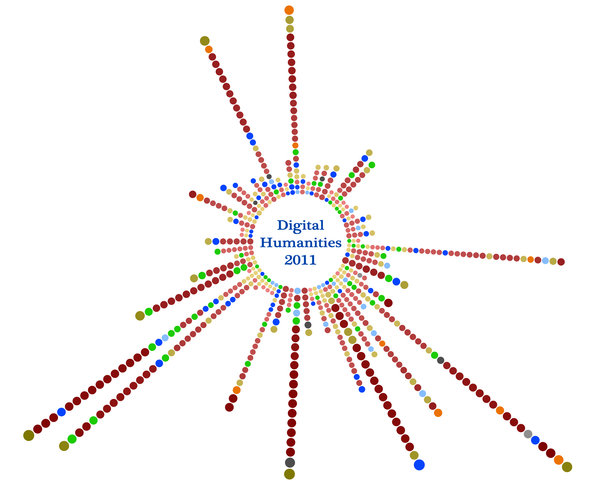
I’m at Digital Humanities 2011: Big Tent Digital Humanities at Stanford University. I was involved in two workshops before the conference on Visualization for Literary History and Text Analysis with Voyeur. (You can see the script to the Voyeur one at DH2011 Voyeur Tools.) I’m also involved in a paper on “Computing in Canada: A History of the Incunabular Years” presented by Victoria Smith and a panel on The Interface to the Collection organized by the INKE Interface Design team. One gratifying thing to see is the visibility of the University of Alberta in the DH 2011 Visualizations set up by the conference organizers. If you zoom in to the different visualizations you will see the number of participants from U of A.

Infomous Clouds

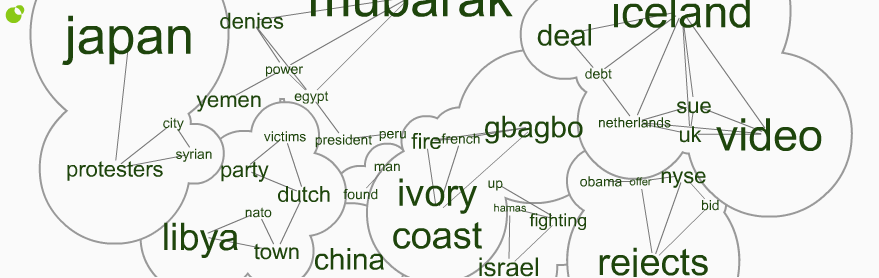
I was on The Atlantic site and noticed a neat visualization badge by Infomous. It is a variant on the usual word cloud that draws lines between related words and puts simple cloud circles around related words. As you can see it doesn’t always get the clouds right. On the left you have Japan connected to protesters and protesters connected to Syria. There is not, however, any connection between Japan and Syria except that protests are happening in both.

If you get an account Infomous lets you make your own clouds.


Update: Pablo Funes from Icosystem Corp sends this email comment on the post:

We use Mark Newman’s algorithm for network communities to identify clusters of news. In your example, Japan and Syria are both connected to “protesters” and therefore share the same cluster even though there are no news articles that bear on both Japan and Syria (so there is no direct connection between both terms). One could argue, with this example at least, that there is a worldwide series of events that have been unfolding over the last few months, with public protests as the visible common feature (Tunisia, Egypt, Libya, and so on) which makes the connection “countries where protests are happening” a relevant one. And yet, it is true that sometimes the connection is not relevant at all, as it happens when generic words, such as “video” or “said” for example, are shared across news stories.

Our Appinions-based clouds rely on sophisticated semantic analysis provided by Appinions.com (see http://www.infomous.com/site/events/JapanNuclear/). Here, topics are connected because they are discussed by the same web user in the same posting. We use the same algorithm to identify clusters in this network. You can turn off clustering by unchecking “groups” on the bottom toolbar.

Topicmarks – summarize your text documents in minutes

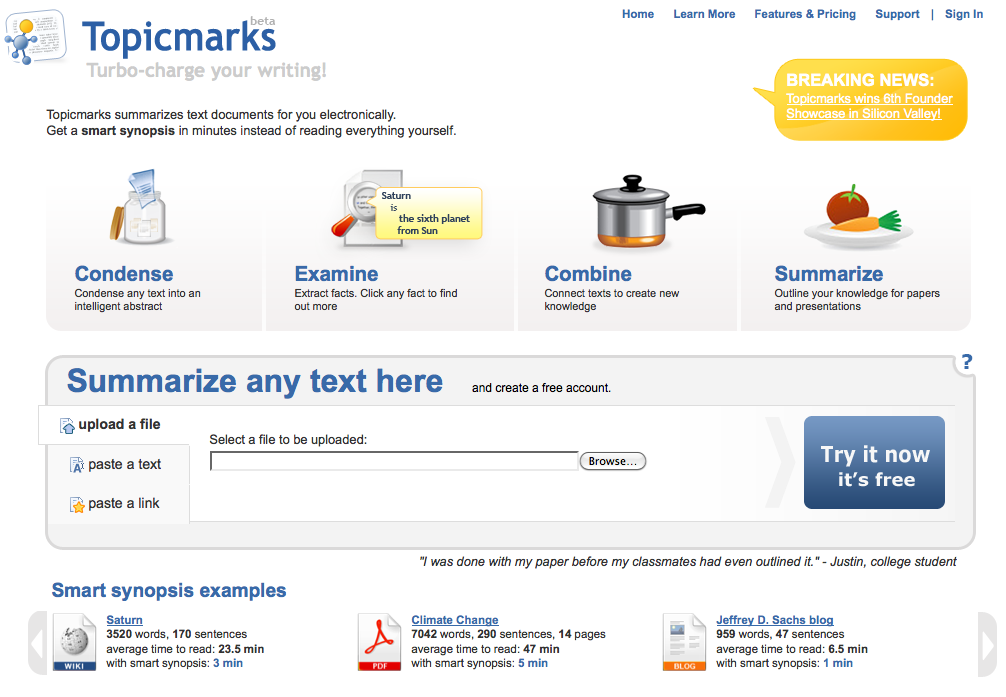
Thanks to Shawn Day’s Day of DH I learned aboutTopicmarks – summarize your text documents in minutes. It is a commercial version of a basic text analysis tool for summarizing readings. They emphasize how much time you spend not reading the whole document analyzed. It reminds me of a playful name we had for a prototype recommendation engine, “Write My Paper”. Look at the screen shot – some of the features they have that we had in TAPoR:

  • Ability to paste text, use an URL, or upload a text
  • Summarizer that combines different tool results
  • Cooking metaphor (we have recipes)

To be honest, TopicMarks deserves points for a simple and clear interface and clear results. They don’t try to do everything. They are also clear on why you would use this (to save time reading.)

Digging Into Data: Second Round Announced

The second round of the Digging Into Data has just been announced and they now have one more country (the Netherlands) and eight international funders. (You can see the SSHRC Announcement here.)

The Digging Into Data challenge is an international grant program that funds groups that have teams in at least two countries so it is good that they are expanding the countries participating. What is even more extraordinary is that they have one adjudication process across all the funders (rather than an adjudication process where each national team has to apply to their own country’s program – which never works.)

I was part of one of the groups that got funding in the first round with the Criminal Intent project. I’ve found the collaboration very fruitful so I’m glad they are supporting this for another round.