Christian directed me to a fascinating chronology of information technology (in French) by Sylvie Fayet-Scribe. It is called Chronologie des supports, des dispositifs spatiaux, des outils de repérage de l’information. and the web design isn’t the best, but it seems detailed and annotated. It seems like a good place to start if you want to understand the types of information aides from encyclopedias, indexes, and so on. Here division of time into epochs is also interesting. The bibliography is also good.
Category: Visualization
Day of Digital Humanities 2010: You are invited to participate
Well, we are starting up the second Day of Digital Humanities project. You are invited to participate!.
You can see what we did in last year’s project here. The idea was to have digital humanists blog one day of what they did and then combine it all into a dataset that can be studied. We call it “autoethnography of a community.” It was fascinating and stressful to run last year. I’m hoping I can enjoy it more this year.
The project will run on March 18th, 2010. We are hoping that we will get more graduate students and more colleagues from outside North America!
Scott Smallwood and Musical Interactives
Scott Smallwood came to talk to our interactives group about his work on musical instruments. Scott was involved with the Princeton Laptop Orchestra (PLOrk) and demonstrated one of the hemispherical speakers that they designed so that laptop musicians could join and play with others. The idea was that a laptop musician, instead of plugging into a sound system (PA), should be able to make sound from where they are just like the analogue instruments. I wonder what the visualization equivalent is? Will these new pocket projectors we can begin to imagine visualization instrument that are portable. Pattie Maes and Pranav Mistry’s demo of SixthSense at TED is an example of creative thinking about outdoor interface.
Ridiculous User Interfaces In Film, and the Man Who Designs Them
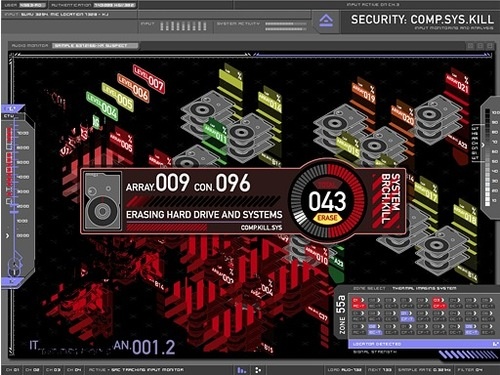
Gizmodo has a short article on Ridiculous User Interfaces In Film, and the Man Who Designs Them. The article showcases graphic designs by Mark Coleran who did work for movies like Mission Impossible 3, Mr & Mrs Smith, and Children of Men. There is a screen reel that summarizes his work and he responds here in his blog. Thanks to Stan for this.
Information Visualization for Text Analysis
Googling around I came across a nice succinct chapter on Information Visualization for Text Analysis from a book called Search User Interfaces by Marti Hearst (Cambridge University Press, 2009).
The chapter goes from visualizations for text mining to concordances and then to citation relationships. It shows some of the usual suspects like TextArc and Wordle.
glia — neuronal jelly with network sauce — 2009.

Thanks to Jason I discovered an interesting collection of animated poetry that plays with type by David Jhave Johnston. See glia — neuronal jelly with network sauce — 2009.. In theory you can embed the animated poems in things, but it didn’t work in this blog. Perhaps they are best seen in glia.
One feature of Johnston’s work is how he plays with type using, among other technologies, Mr. Softie from Obx Labs.
BigSee in a Cave

We got the Big See project working in the cave at U Alberta. The Big See software has various 3D modes so it can be displayed for viewing in a CAVE.


JSTOR: Data for Research Visualization

Thanks to Judith I have been playing with JSTOR’s Data for Research (DfR). They provide a faceted way of visualizing and search the entire JSTOR database. Features include:
- Full-text and fielded searching of the entire JSTOR archive using a powerful faceted search interface. Using this interface one can quickly and easily define content of interest through an iterative process of searching and results filtering.
- Online viewing of document-level data including word frequencies, citations, key terms, and ngrams.
- Request and download datasets containing word frequencies, citations, key terms, or ngrams associated with the content selected.
- API for content selection and retrieval. (from the About page)
I’m impressed by how much they expose. They even have a Submit Data Request and an API. This is important – we are seeing a large scale repository exposing its information to new types of queries other than just search.
The Billion Dollar Gram | Information Is Beautiful

Stan sent me a link to this blog about information and visualization, Information Is Beautiful. Take, for example, The Billion Dollar Gram which shows and compares things that billions of dollars are being spent on.
Circos – visualize genomes and genomic data

Stan pointed me to a neat circular visualization tool, Circos – visualize genomes and genomic data. As the site title says, Circos is for visualizing genomic information, but the circular model strikes me a applicable to other domains. In fact, Camilo Arango in Computing Science, just defended a MSc thesis on a Course Browser design that uses a circular design to show requisites between courses. While the circular design is attractive, I wonder if it is misleading for linear information, like a text, if one wraps the text around the edge of the circle, the way TextArc does.
The Circos site has an interesting slide show on visualizing quantitative information by Martin Krzywinski that starts with Tufte and then shows different genomic visualization models leading up to Circos.