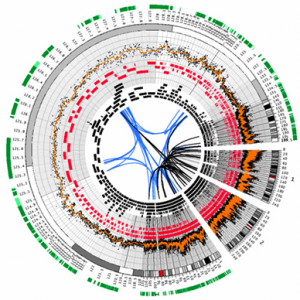
Stan pointed me to a neat circular visualization tool, Circos – visualize genomes and genomic data. As the site title says, Circos is for visualizing genomic information, but the circular model strikes me a applicable to other domains. In fact, Camilo Arango in Computing Science, just defended a MSc thesis on a Course Browser design that uses a circular design to show requisites between courses. While the circular design is attractive, I wonder if it is misleading for linear information, like a text, if one wraps the text around the edge of the circle, the way TextArc does.
The Circos site has an interesting slide show on visualizing quantitative information by Martin Krzywinski that starts with Tufte and then shows different genomic visualization models leading up to Circos.