 The Metacombine Multidimensional Visualization Project has been developing Java interactive visualizations for digital libraries. They use prefuse: an interactive visualization toolkit to create the multi-dimensional visualizations. They also have a good section on the dimensionality reduction techniques they use like principal component analysis.
Category: Visualization
Dogpile: Search Comparison Visualization
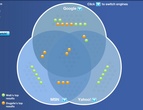
StÈfan has a blog entry on Dogpile Search Comparitor tool which produces a venn diagram of the results from different search engines. The interface, however, has a fatal flaw. You can’t link to the resulting sites that are common to more than one search engine (and presumably are the ones you want). The little pills in the middle – which stand for the shared results link to a Dogpile listing, not to the resulting site itself.
Buzztracker: News location visualization
buzztracker is an interesting visualization of Google News that is mapped onto a map of the world to show the places in the news and their relationships.
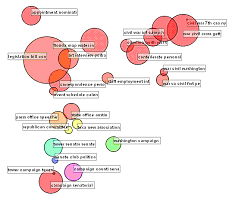
Leximancer

Leximancer is a text mapping and mining application that creates visualizations of texts that can be made available over the web in interactive form. See the Leximancer Gallery.
Continue reading Leximancer
Escape Route
Escape Route is a “photographic travelogue” which shows a 3D itinerary or 2D itinerary of locations for which there are photos. The itineraryies are mapped onto 3d or 2d globes space. There are neat animations for when you collapse from 3d to 2d. I’m so intrigued by the navigation interface I haven’t really looked at the snaps. Thanks to Drew Paulin for this.
Gospel Spectrum
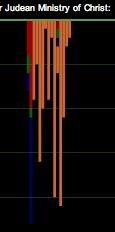 Gospel Spectrum Beta is a New Testament visualization tool that allows you to see the events of Jesus’ life described in the gospels and whether the gospels are in harmony. The vertical lines are verses on an event. The colours are the different gospel writers. Zooming in eventually allows you to see the full text. Quite a nice custom visualization. Thanks to Drew Paulin for this.
LivePlasma

liveplasma is a search and visualization engine for music and movies that shows you related things in a colourful bubbly space. This is thanks to Steve Ramsay.
Matt Patey’s Re
Notes on text analysis and toys is a blog by a student here at Mac, Matt Patey, on a project for visualizing the neighborhood of a web site. He is combining text analysis techniques to build picture of how a page sits with others with a similar profile.
ni9e: Grafitti Analysis
Geoffrey Tressider sent me a link to ni9e, a site by two designers with a number of text visualization and design projects including a “Graffiti Analysis” project where they track the gestures of creating grafitti and then use the gestures to create new works. An interesting take on visualizing text – here they visualize the graphic gestures.
Check out how they paint with letters in “typo graphic illus tration” and similar projects.
FreeMind: Free Mind Mapping
 FreeMind is free Mind Mapping software that works on most platforms. It has cool feature where it can create navigable map of your file structure. The .mm files are XML so one should be able to do other sorts of transformations on them.
Continue reading FreeMind: Free Mind Mapping