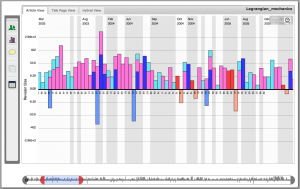
Ofer showed me a interactive visualization of the collaboration around a Wikipedia article. The visualization shows the edits (deletions/insertions) over time in different ways. It allows one to study distributed collaborations (or lack thereof) around things like a Wikipedia article. The ideas can be applied to visualizing any collaboration for which you have data (as often happens when the collaboration happens through digital tools that record activity.)
His hypothesis is that theories about how site-specific teams collaboration don’t apply to distributed teams. Office teams have been studied, but there isn’t a lot of research on how voluntary and distributed teams work.
