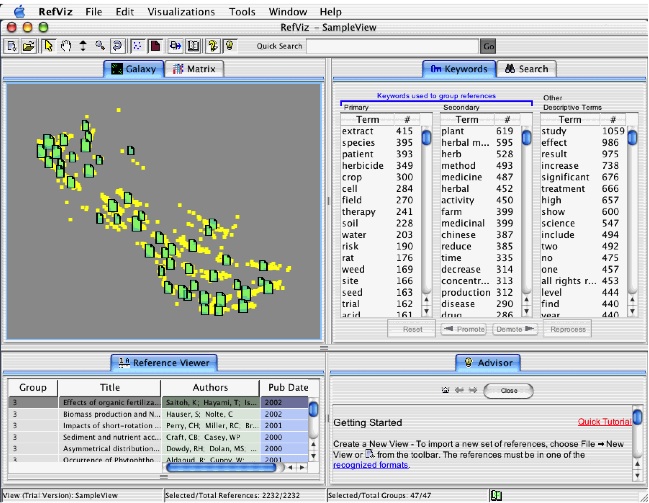
Tim Russell sent me a link to a tool that creates a visualization of Websites as graphs – an HTML DOM Visualizer Applet. This link will generate a graph of the McMaster site if you have Java. There is also a link to examples on flickr – Flickr: Photos tagged with websitesasgraphs.
Category: Visualization
SIMWeb
SIMWeb is one of the first web text visualization tools I made. It visually represents the results from Correspondence Analysis on Hume’s Dialogues Concerning Natural Religion.
I blogging this partly because I keep on losing the location of the site.
Mandala Browser
My colleague StÈfan Sinclair has recently set up a site for the Mandala: Rich Prospect Browser text visualization project that he leads. The current prototype was programmed in Flash, but he is reimplementing it in Java. It is one of the more original ideas for visualization that I have seen in a while and builds on Stan Ruecker’s ideas for rich prospect browsing where you can see some representation of the whole of your evidence (the prospect) while manipulating the details. StÈfan has also been working with ideas of direct manipulation of that whole. In Mandala you create dimensions based on criteria (author = X, Y, or Z) that act as attractors.
CNET Story Visualizations
CNET News.com has two interesting types of visualization available alongside their stories.
The Big Picture is bubble graph that shows links out from the story you are looking at.
What’s Hot shows the hot stories in coloured boxes where size shows popularity and colour shows how recent the story is.
It’s not clear how they measure “hot”. Is a cool story hot?
Regular Expression reAnimator
StÈfan Sinclair has blogged in Visualizing Regular Expressions a project by Oliver Steele that animates regular expressions (those cryptic things you write when searching texts for patterns.) Regular expressions and pattern matching have a long and interesting history that has yet to be written. Two points:
- Steve Ramsay has a nice page on regular expressions where he provides a short history,
Regular expressions trace back to the work of an American mathematician by the name of Stephen Kleene (one of the most influential figures in the development of theoretical computer science) who developed regular expressions as a notation for describing what he called “the algebra of regular sets.” His work eventually found its way into some early efforts with computational search algorithms, and from there to some of the earliest text-manipulation tools on the Unix platform (including ed and grep). In the context of computer searches, the “*” is formally known as a “Kleene star.”
- The Haubens in the online archive of Netizens describe the development of Grep as the one of the first tools to demonstrate the power of piping in Unix,
Grep is listed in the Manual for Version 4 Unix which is dated November, 1973. The date given for the creation of grep is March 3, 1973, following the creation of pipes.(43) The creation of grep, McIlroy explains, was followed by the invention of other special purpose software programs that could be used as tools.
Regular expression (regex) matching since Grep shows up as a language within most other languages (like Ruby and Java) for handling strings. It is the archetype of the software tool – a utility within a larger environment or application. This is something I commented on in MIMes and MeRMAids.
Google Visualizations
Looks like Google has been developing demo visualizations, see Even More Google Photos.
Spelling with Flickr
Spell with Flickr is a neat site that will spell out words using pictures of letters from Flickr. It is by Erik F. Kastner and comes with code to use in your site. This is thanks to Matt.
External Cognition: How do Graphical Representations Work?
Likewise , as we argued in describing the resemblance fallacy , making assumptions that the internal representation is a mental model or image-like may simply give the illusion of solving the processing-internal representation-external representation riddle. (p. 209)
Do we understand how visualizations work, if at all? Work on visualization seems to be premised on the intuition that “a picture is worth a thousand words”. External Cognition: How do Graphical Representations Work? (PDF) by Scaife and Rogers (Int . J . Human – Computer Studies (1996) 45 , 185 – 213) is a metastudy that questions what we really know.
Continue reading External Cognition: How do Graphical Representations Work?
Phylotaxis: Science and Culture
How to visualize news? Phylotaxis by Jonathan Harris (who also did 10X10) is blog/news visualizer designed for Seed: Science is Culture magazine. I think I am going to start a Jonathan Harris fan club – all of his work is perfect in its simplicity and effectiveness.
Power of Words Visualization
The Power Of Words is a project by students of my colleagues StÈfan Sinclair. It is both interesting visually and relevant to current events. I am impressed by the work his students are doing. I found it on his blog entry, The Power of Words.