 On the Independent I came across the interactive visualization above onMapping the crisis in Gaza. The visualization environment looks like your standard bubblegraph, but has lots of other features as you can see from the toolbar at the bottom. Here is another view:
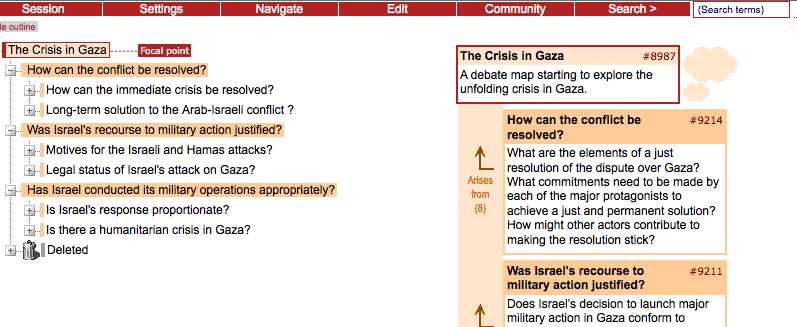
The maps can be edited by users – they have wiki features for those who register accounts. In some ways they are communal mind maps. The software comes from Debategraph.org.