Escape Route is a “photographic travelogue” which shows a 3D itinerary or 2D itinerary of locations for which there are photos. The itineraryies are mapped onto 3d or 2d globes space. There are neat animations for when you collapse from 3d to 2d. I’m so intrigued by the navigation interface I haven’t really looked at the snaps. Thanks to Drew Paulin for this.
Category: Visualization
Gospel Spectrum
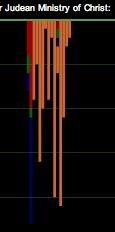 Gospel Spectrum Beta is a New Testament visualization tool that allows you to see the events of Jesus’ life described in the gospels and whether the gospels are in harmony. The vertical lines are verses on an event. The colours are the different gospel writers. Zooming in eventually allows you to see the full text. Quite a nice custom visualization. Thanks to Drew Paulin for this.
LivePlasma

liveplasma is a search and visualization engine for music and movies that shows you related things in a colourful bubbly space. This is thanks to Steve Ramsay.
Matt Patey’s Re
Notes on text analysis and toys is a blog by a student here at Mac, Matt Patey, on a project for visualizing the neighborhood of a web site. He is combining text analysis techniques to build picture of how a page sits with others with a similar profile.
ni9e: Grafitti Analysis
Geoffrey Tressider sent me a link to ni9e, a site by two designers with a number of text visualization and design projects including a “Graffiti Analysis” project where they track the gestures of creating grafitti and then use the gestures to create new works. An interesting take on visualizing text – here they visualize the graphic gestures.
Check out how they paint with letters in “typo graphic illus tration” and similar projects.
FreeMind: Free Mind Mapping
 FreeMind is free Mind Mapping software that works on most platforms. It has cool feature where it can create navigable map of your file structure. The .mm files are XML so one should be able to do other sorts of transformations on them.
Continue reading FreeMind: Free Mind Mapping
Baby Name Wizard NameVoyager
Steve Ramsay turned me on to a fascinating diachronic name visualization, The Baby Name Wizard’s NameVoyager. You can type in your name and see its rise and fall over time. Can we create a distribution graph of the top 1000 words in a text like this?
More on Mindmapping
In a previous blog I wrote about Mind Mapping and software that supports it. This came from a one day workshop. I just got the notes from the workshop and here are some of the mindmapping tools that were mentioned:
- VisualMind, Pricing: Basic $69.00usd, Business $149.00usd
- Freemind, Free software
- MindManager, Pricing: MindManager X5Pro $284.05usd, MindManager X5 $199.00usd (Prices increasing Jan 1st, 2005)
- NovaMind Price $103.00cad
- Map It, Price $78.00usd
- Mindgenius, MindGenius business $189 MindGenius education $97 MindGenius home $53 MindGenius brainbloom $53
- Visimap, Price $125.00usd
- Openmind, Price $249.00usd
Tufte: Visual and Statistical Thinking
Visual and Statistical Thinking is a “textbooklet” by Edward Tufte that Lorna got me (along for a replacement for my missing The Cognitive Style of PowerPoint. It looks closely at two examples of how graphs were used to think through a problem in order to recommend action; first John Snow’s analysis of the Broad Street cholera epidemic, and then the decision to launch the space shuttle Challenger. Tuftewrites that his “general argument is straightforward”:
An essential analytic task in making decisions based on evidence is to understand how things work – mechanism, trade-offs, process and dynamics, cause and effect. That is, intervention-thinking and policy-thinking demand causality-thinking.
Making decisions based on evidence requires the appropriate display of that evidence. Good displays of data help to reveal knowledge relevant to understanding mechanism, process and dynamics, cause and effect. That is, displays of statistical data should directly serve the analytic task at hand. (p. 3, copyright 1997, Graphics Press, Cheshire, Connecticut).
Text visualization in the humanities is not, however meant to guide decisions. Literary analysis guides interpretation which does not lead immediately or causally to decisions. What then is point of interpretative analysis (visual or not)? An extreme view would be that it is an art; the art of creating new aesthetic works of a particular genre called intepretation that stand in a particular relationship with other works. Interpretations are made or crafted from abstract matter, namely other works of art. Their appreciation is predicated on knowledge of the “original”.
Continue reading Tufte: Visual and Statistical Thinking
CANARIE and Video Conferencing
I’m at the CANARIE Advanced Networks Workshop 2004 today after wrapping up at The Face of Text. I gave a talk about TAPoR – the token humanist at this conference. Most of the talks in my session are about video conferencing over the net and telepresence.
My sense is that “access grids” for shared network meetings are close to being usable. The ViDe Videoconferencing Cookbook was suggested a good starting point if you want to try a virtual meeting.