What a fossil revolution reveals about the history of ‘big data’

Example of Heinrich Georg Bronn’s Spindle Diagram

David Sepkoski has published a nice essay in Aeon about What a fossil revolution reveals about the history of ‘big data’. Sepkoski talks about his father (Jack Sepkoski), a paleontologist, who developed the first database to provide a comprehensive record of fossils. This data was used to interpret the fossil record differently. The essay argues that it changed how we “see” data and showed that there had been mass extinctions before (and that we might be in one now).

The analysis that he and his colleagues performed revealed new understandings of phenomena such as diversification and extinction, and changed the way that palaeontologists work.

Sepkoski (father) and colleagues

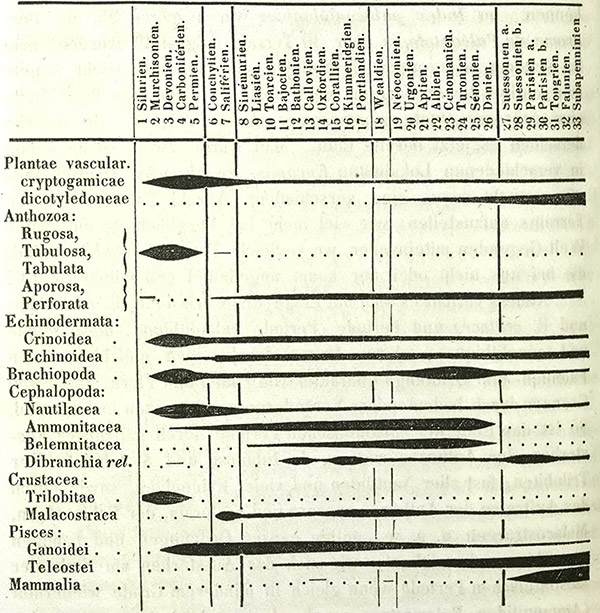
The essay then makes the interesting move of arguing that, in fact, Jack Sepkoski was not the first to do quantitative palaeontology. The son, a historian, argues that Heinrich Georg Bronn in the 19th century was collecting similar data on paper and visualizing it (see spindle diagram above), but his approach didn’t take.

This raises the question of why Sepkoski senior’s data-driven approach changed palaeontology while Bronn’s didn’t. Sepkoski junior’s answer is a combination of changes. First, that palaeontology became more receptive to ideas like Stephen Jay Gould’s “punctuated equillibrium” that challenged Darwin’s gradualist view. Second, that culture has become more open to data-driven approaches and the interpretation visualizations needed to grasp such approaches.

The essay concludes by warning us about the dangers of believing data black boxes and visualizations that you can’t unpack.

Yet in our own time, it’s taken for granted that the best way of understanding large, complex phenomena often involves ‘crunching’ the numbers via computers, and projecting the results as visual summaries.

That’s not a bad thing, but it poses some challenges. In many scientific fields, from genetics to economics to palaeobiology, a kind of implicit trust is placed in the images and the algorithms that produce them. Often viewers have almost no idea how they were constructed.

This leads me to ask about the warning as gesture. This is a gesture we see more and more, especially about the ethics of big data and about artificial intelligence. No thoughtful person, including myself, has not warned people about the dangers of these apparently new technologies. But what good are these warnings?

Johanna Drucker in Graphesis proposes what to my mind is a much healthier approach to the dangers and opportunities of visualization. She does what humanists do, she asks us to think of visualization as interpretation. If you think of it this way than it is no more or less dangerous than any other interpretation. And, we have the tools to think-through visualization. She shows us how to look at the genealogy of different types of visualization. She shows us how all visualizations are interpretations and therefore need to be read. She frees us to be interpretative with our visualizations. If they are made by the visualizer and are not given by the data as by Moses coming down the mountain, then they are an art that we can play with and through. This is what the 3DH project is about.

Digital Cultures Big Data And Society

Last week I presented a keynote at the Digital Cultures, Big Data and Society conference. (You can seem my conference notes at Digital Cultures Big Data And Society.) The talk I gave was titled “Thinking-Through Big Data in the Humanities” in which I argued that the humanities have the history, skills and responsibility to engage with the topic of big data:

  • First, I outlined how the humanities have a history of dealing with big data. As we all know, ideas have histories, and we in the humanities know how to learn from the genesis of these ideas.
  • Second, I illustrated how we can contribute by learning to read the new genres of documents and tools that characterize big data discourse.
  • And lastly, I turned to the ethics of big data research, especially as it concerns us as we are tempted by the treasures at hand.

Continue reading Digital Cultures Big Data And Society

Opinion | America’s Real Digital Divide

The problem isn’t that poor children don’t have access to computers. It’s that they spend too much time in front of them.

The New York Times has an important Opinion about America’s Real Digital Divide by Naomi S. Riley from Feb. 11, 2018. She argues that TV and video game screen time is bad for children and there is no evidence that computer screen time is helpful. The digital divide is not one of access to screens but one of attitude and education on screen time.

But no one is telling poorer parents about the dangers of screen time. For instance, according to a 2012 Pew survey, just 39 percent of parents with incomes of less than $30,000 a year say they are “very concerned” about this issue, compared with about six in 10 parents in higher-earning households.

An Introduction to Digital Computers

On Humanist there was an announcement from the Hagley Museum and Library that they had put up a 1969 Sperry-UNIVAC short film An Introduction to Digital Computers. The 22 minute short is a dated, but interesting introduction to how a digital computer works. The short was sponsored by Sperry-UNIVAC which had its origins in the Eckert-Mauchly Computer Corporation founded by Eckert and Mauchly of ENIAC fame.

The museum is in Delaware at the site of E.I. du Pont gunpowder works from 1802. The Hagley library is dedicated to American enterprise and has archival material from Sperry-UNIVAC:

Hagley’s library furthers the study of business and technology in America. The collections include individuals’ papers and companies’ records ranging from eighteenth-century merchants to modern telecommunications and illustrate the impact of the business system on society.

Social networks are creating a global crisis of democracy

[N]etworks themselves offer ways in which bad actors – and not only the Russian government – can undermine democracy by disseminating fake news and extreme views. “These social platforms are all invented by very liberal people on the west and east coasts,” said Brad Parscale, Mr. Trump’s digital-media director, in an interview last year. “And we figure out how to use it to push conservative values. I don’t think they thought that would ever happen.” Too right.

The Globe and Mail this weekend had an essay by Niall Ferguson on how Social networks are creating a global crisis of democracy. The article is based on Ferguson’s new book The Square and the Tower: Networks and Power from the Freemasons to Facebook. The article points out that manipulation is not just an American problem, but also points out that the real problem is our dependence on social networks in the first place.

Continue reading Social networks are creating a global crisis of democracy

Python Programming for the Humanities by Folgert Karsdorp

Having just finished teaching a course on Big Data and Text Analysis where I taught students Python I can appreciate a well written tutorial on Python. Python Programming for the Humanities by Folgert Karsdorp is a great tutorial for humanists new to programming that takes the form of a series of Jupyter notebooks that students can download. As the tutorials are notebooks, if students have set up Python on their computers then they can use the tutorials interactively. Karsdorp has done a nice job of weaving in cells where the student has to code and Quizes which reinforce the materials which strikes me as an excellent use of the IPython notebook model.

I learned about this reading a more advanced set of tutorials from Allen Riddell for Dariah-DE, Text Analysis with Topic Models for the Humanities and Social Sciences. The title doesn’t do this collection of tutorials justice because they include a lot more than just Topic Models. There are advanced tutorials on all sorts of topics like machine learning and classification. See the index for the range of tutorials.

Text Analysis with Topic Models for the Humanities and Social Sciences (TAToM) consists of a series of tutorials covering basic procedures in quantitative text analysis. The tutorials cover the preparation of a text corpus for analysis and the exploration of a collection of texts using topic models and machine learning.

Stéfan Sinclair and I (mostly Stéfan) have also produced a textbook for teaching programming to humanists called The Art of Literary Text Analysis. These tutorials are also written as Jupyter notebooks so you can download them and play with them.

We are now reimplementing them with our own Voyant-based notebook environment called Spyral. See The Art of Literary Text Analysis with Spyral Notebooks. More on this in another blog entry.

At this year’s MLA, many sessions focus on fake news in present and in literary past

At this year’s MLA meeting, many sessions will focus on fake news, both in the present and in the literary past. Can scholars of fiction change our understanding of current events?

From Humanist a link to an article by Scott Jaschik about fake news and the MLA. The article is in Inside Higher Ed and is titled, ‘All Ladies Cheat… Sad!’:At this year’s MLA, many sessions focus on fake news in present and in literary past. The article talks about sessions at the MLA taking on the issue of truth. It points out that poststructuralist scholars like the late Derrida have appeared to undermine our notions of truth leaving us with the idea that truth is constructed.

One irony is that, in many of those discussions, conservative commentators accused humanities scholars of the left of ignoring issues of truth. And Ben-Merre acknowledged that some may say poststructuralists such as the late theorist Jacques Derrida may have contributed to the current situation by questioning then-prevailing attitudes about what constituted truth.

If the truth is ideologically constructed then what’s wrong with Trump’s base constructing their own truth? Are we doomed to our silos? These MLA talks seem to be a rich set of ways of understanding the issues of fake news in terms of fiction and truth, but I think we also need to think of ways of bridging the truths which is why I liked In Conversation: Robert Reich and Arlie Hochschild (video of conversation from 3quarksdaily.) Hochschild talks about her new book, Strangers In Their Own Land which listens to a Tea Party community in Alabama. Hochschild also talks about how one can build bridges by stretching values so they can be shared and provide a ground for dialogue. Yet another way of making truths.

Transverse Reading Gallery

From Alan Liu I learned about the Transverse Reading Gallery , a project mapping interactive narratives from the Demian Katz Gamebook Collection led by Jeremy Douglass. In an background paper on the project titled, Graphing Branching Narrative Douglass starts by asking,

What are the different forms of interactive stories? Which are the biggest and smallest, the simplest and most complex? What are the most typical and the most unusual? When we consider the structures of interactive narratives, are there local features or overall shapes that correspond to particular genres, authors, languages, time periods, or media forms?

The project web site is simple and informative. It includes a blog with short essays by research assistants. What you can see is the different topologies of these gamebooks from the tall ones with lots of choices but little narrative to the wide ones with lots of story, but little branching.

Are Algorithms Building the New Infrastructure of Racism?

Robert Moses

3quarksdaily, one of the better web sites for extracts of interesting essays, pointed me to this essay on Are Algorithms Building the New Infrastructure of Racism? in Nautilus by Aaron M. Bornstein (Dec. 21, 2017). The article reviews some of the terrain covered by Cathy O’Neil’s book Weapons of Math Destruction, but the article also points out how AIs are becoming infrastructure and infrastructure with bias baked in is very hard to change, like the low bridges that Robert Moses built to make it hard for public transit to make it into certain areas of NYC. Algorithmic decisions that are biased and visible can be studied and corrected. Decisions that get built into infrastructure disappear and get much harder to fix.

a fundamental question in algorithmic fairness is the degree to which algorithms can be made to understand the social and historical context of the data they use …

Just as important is paying attention to the data that is used to train the AIs in the first place. Historic data carries the biases of these generations and they need to be questioned as they get woven into our infrastructure.

Missed the bitcoin boom? Five more baffling cryptocurrencies to blow your savings on

One of the oddest Ethereum projects in operation, CryptoKitties is a three-way cross between Tamagotchis, Beanie Babies and animal husbandry. Users can buy, sell and breed the eponymous cats, with traits inherited down the generations.

The Guardian has a nice story on Missed the bitcoin boom? Five more baffling cryptocurrencies to blow your savings onThe article talks about CryptoKitties, a form of collectible pet (kitty) game that is built on blockchain technology. If you invest you get a kitty or two and then you can breed them to evolve new kitties. The kitties can then be sold as collectibles to others to breed. Apparently 11% of Traffic on the Ethereum Blockchain Is Being Used to Breed Digital Cats (CryptoKitties). If you missed investing in bitcoin, now is the chance to buy a kitty or two.

The question is whether this is gambling or a game?