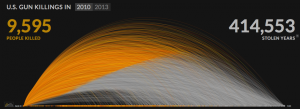
Jennifer sent me a link to an animated visualization of U.S. Gun Killings in 2010. The visualization shows the years lost by people being killed with guns. It animates their lives as arcs that change at the moment of death, but continue so that you can see how long they might have lived.
This visualization shows how animation can add to a visualization. In this case it adds drama and a sense of the individual lives. In many cases animation hides information as much as it shows like a slide show that hides one slide to show another. I’m convinced animated visualizations can do more, but haven’t come across that many.
